


INTRODUCTION
The use of patient-reported outcome measures (PROMs) has increased as a way to assess how patients self-evaluate their own health and capabilities before and after undergoing anterior cervical discectomy and fusion (ACDF) [1-3]. With the advent of newer scoring systems, numerous PROMs have become known as “legacy” measures, with rigorously studied histories of evaluating presurgical and postsurgical outcomes. Several of the “legacy” measures that are most relevant to cervical surgery include questionnaires such as the Neck Disability Index (NDI), the visual analogue scale (VAS) which evaluates levels of pain, and surveys that evaluate overall health, such as the 36-Item ShortForm Health Survey [4]. These “legacy” evaluation systems have demonstrated high levels of reliability and validity [5-8]. Despite these advantages, they can have limited generalizability among various populations and procedure types. Legacy PROMs can also be prone to biases, and are often burdensome for the clinic to administer and for the patient to complete [9-12].
The development of the Patient-Reported Outcomes Measurement Information System (PROMIS) physical function (PF) reflects an improvement in many of these shortcomings, and furthermore, is becoming increasingly validated with respect to ACDF procedures [13,14]. An analysis of PROMIS PF scoring is ideal for ACDF procedures because the system allows for a more global health assessment, fewer questions, and without the need to administer different questionnaires for separate anatomical locations (e.g., arm, neck, etc.). These new strengths increase the utility of PROMIS and may reduce clinical burden.
PROMIS questions are based on a series of domains that include mental, physical, and psychosocial health. Having this broad scope has contributed to an evidence-based reliability that captures relevant decreases in function that might be related to numerous medical conditions. Efficient patient characterizations are achieved by only administering necessary questions for evaluation [6,10]. PROMIS is also unique in that it offers a computer adaptive test (CAT) that customizes questions based on each patient’s response. Research on CAT systems has observed increased evaluation accuracy because the assessments are focused on each patient’s responses, and efficiency is increased because only questions that are necessary for evaluation are asked [9]. While PROMIS, PROMIS PF, and PROMIS PF CAT have different technical referents, in this manuscript, these terms are used interchangeably to refer to the PROMIS PF CAT score. Furthermore, CAT is particularly helpful in evaluating patients with musculoskeletal and spinal pathologies that have undergone surgery. These patients often seek help due to a perceived lack of PF with the goal of improving this dysfunction [9]. Importantly, PROMIS scores can be compared longitudinally, even as the scoring system receives scheduled updates [15].
Though PROMIS PF is most often utilized as a method of evaluation, preoperative scores derived from this metric may be associated with ACDF postsurgical outcomes. The possible influence of preoperative PROMIS PF scores on postoperative PROMIS PF score change has yet to be addressed by current research. The primary aim of this study is to evaluate the association of preoperative PROMIS among patients undergoing ACDF, and to examine mean changes occurring between preoperative and postoperative PROMIS-PF scores. Investigators have previously observed postoperative pain to be associated with the number of vertebral levels on which surgery was performed, irrespective of the spinal region [16]. Hence, this study focused on single-level procedures to limit potential confounding that might be experienced due to variability in PF encountered after operations involving multiple levels.
MATERIALS AND METHODS
1. Patient Population
After receiving Institutional Review Board approval of Rush University Medical Center (ORA #14051301), a prospectively maintained surgical registry of patients undergoing spine surgery between May 2015 and November 2018 was retrospectively reviewed for eligible patients. Inclusion criteria were primary or revision, elective, single-level ACDF procedures. Exclusion criteria included, multilevel procedures and patients without preoperative PROMIS surveys. All patients were treated by a single surgeon at a single academic institution.
2. Data Collection
Baseline patient characteristics and demographics were recorded including, age, sex, smoking status, body mass index (BMI), insurance coverage (Medicare/Medicaid or Workers Compensation/Private), and Charlson Comorbidity Index (CCI). Preoperative comorbid diagnoses were recorded, including acquired immunodeficiency syndrome, arthritis, chronic obstructive pulmonary disease, complicated diabetes, congestive heart failure, gastrointestinal bleeding, hypertension, liver disease, malignancy, metastatic disease, myocardial infarction, neurologic disease, paraplegia, peripheral vascular disease, renal failure, and uncomplicated diabetes. Preoperative spinal diagnoses were recorded, including herniated nucleus pulposus, degenerative disc disease, spinal stenosis, foraminal stenosis, and trauma. Perioperative characteristics were collected, including estimated blood loss (EBL), primary or revision procedure status, operative time (time from skin incision to closure), length of hospital stay, and day of discharge. Fusion rate was evaluated during postoperative clinic visits by either radiograph or computed tomography (CT). Postoperative complications were recorded for all patients. Previously defined cut-points were used to define between “fair” ≥ 35.0 versus “poor” < 35.0 PROMIS score subgroups [17-19]. Patients were categorized by preoperative PROMIS scores (e.g., ≥ 35.0, < 35.0), with higher PROMIS scores representing greater PF. Postoperative PROMIS scores were recorded at the 6-week, 12-week, 6-month, and 1-year time points.
3. Statistical Analysis
Stata 16.0 (StataCorp, College Station, TX, USA) was used to perform a chi-square test analysis to detect for association of PROMIS subgroups in the following demographic variables: sex, smoking status, diagnosis, BMI, and insurance coverage (Table 1). Continuous demographic variables such as age and CCI were assessed with a Student t-test. PROMIS subgroups for operative characteristics including operative time, EBL, fusion rate, length of hospital stay, and day of discharge were also assessed with a Student t-test (Table 2). Postoperative complications were evaluated among subgroups with a chi-square test (Table 3). Mean PROMIS scores at all time points were evaluated using a t-test to detect a difference between PROMIS subgroups (Table 4). Postoperative PROMIS improvement (postoperative–preoperative) was analyzed using a t-test to detect differences at the 6-week, 12-week, 6-month, and 1-year time points (Table 5). Patients who did not fill out a survey at a time point were excluded from the analysis at that time point. A paired t-test compared intragroup pre- and postoperative scores at each time point to evaluate for statistically significant improvement (Table 6). Other PROMs were also assessed in the same manner as PROMIS subgroups, including the VAS arm, VAS neck, NDI and 12-Item Short-Form Health Survey (SF-12) (Table 7). The mean PROMIS score and improvement in PROMIS score were graphed using a scatter plot. Linear regressions were plotted using GraphPad Prism 8.0 for Mac (La Jolla, CA, USA) to evaluate the relationship between preoperative PROMIS scores and postoperative PROMIS score improvements (Figs. 1-5). Statistical significance was set at p < 0.05.
RESULTS
1. Demographic Characteristics
A total of 86 patients were identified between May 2015 and November 2018 who underwent primary or revision, single-level ACDF procedures. The cohort was 61.6% male with an average age of 47.3± 9.5 years of which 51.2% were obese (BMI ≥ 30 kg/m2). Table 1 displays baseline characteristics and patient demographics. The 19 subjects in the preoperative PROMIS < 35 group had a significantly younger mean age (41.3 years vs. 49.1 years, p = 0.001) compared to the PROMIS ≥ 35 group. There was no significant difference between groups for the remaining variables including age, smoking status, BMI, insurance, CCI, preoperative comorbid diagnoses, or spinal diagnoses.
2. Perioperative Characteristics
There was no significant difference between groups for any perioperative characteristics including operative time, EBL, hospital length of stay, day of discharge or fusion rate (Table 2). There were no significant differences in the proportion of postoperative complications between groups (Table 3).
3. PROMIS Outcomes
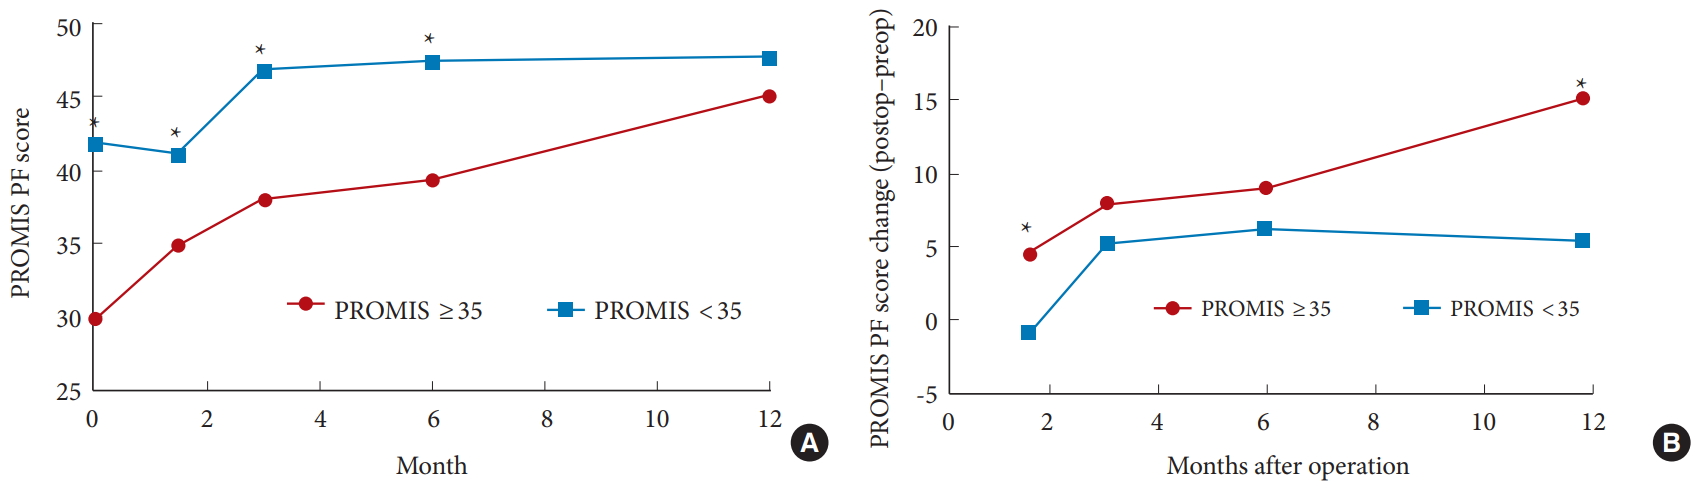
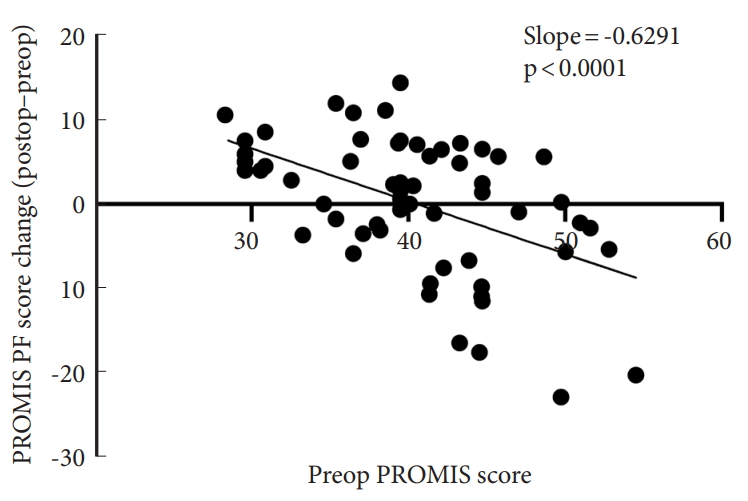
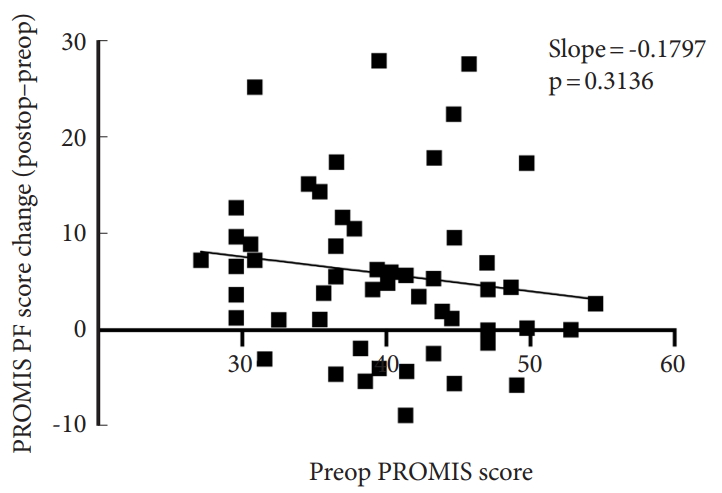
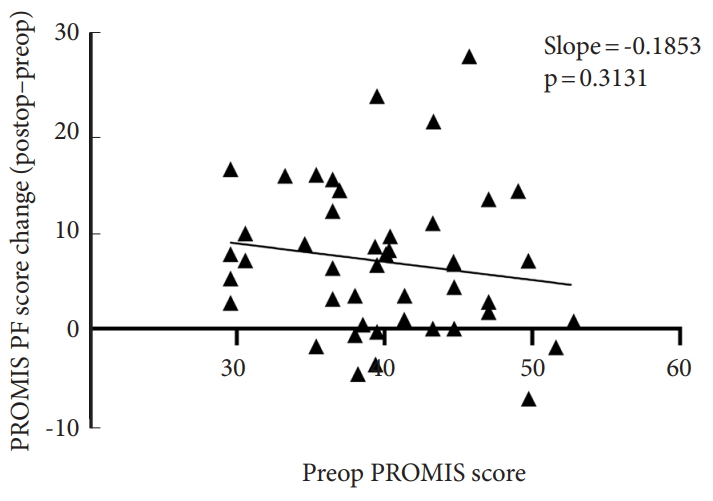
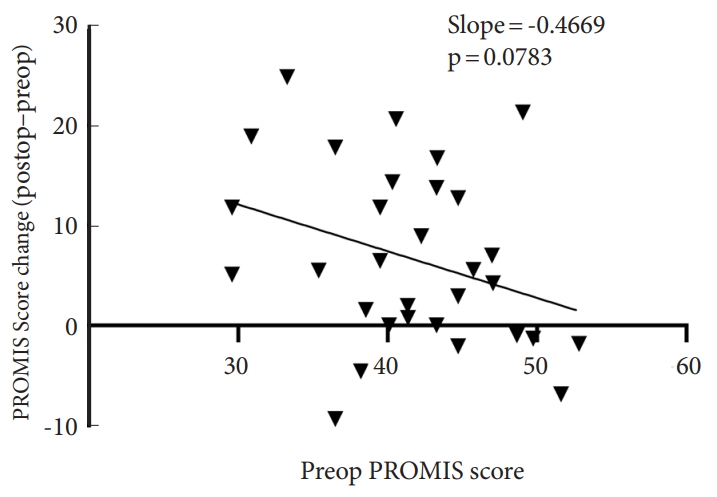
The PROMIS < 35.0 group had significantly lower PROMIS scores preoperatively (29.9 vs. 42.5, p < 0.001), at 6 weeks (35.2 vs 41.7, p = 0.006), at 12 weeks (38.5 vs 47.6, p = 0.006), and at 6 months (39.9 vs 48.3, p = 0.014) postoperatively when compared to PROMIS ≥ 35.0 group (Table 4, Fig. 1A). This difference was lost between subgroups at the 1-year time point (45.9 vs. 48.6, p = 0.591). The PROMIS < 35.0 group had a significantly larger improvement of PROMIS scores when compared to the PROMIS ≥ 35.0 at the 6-week (4.5 vs. -0.84, p = 0.041) and 1-year (15.1 vs. 5.4, p = 0.038) postoperative time points (Table 5, Fig. 1B). At the 12-week and 6-month postoperative time points, the PROMIS < 35.0 group continued to have an increased improvement compared to the PROMIS ≥ 35.0 group, but it was not statistically significant. Both the subgroups demonstrated statistically significant improvements between their pre- and postoperative scores at each time point (Table 6). Following linear regression, a significant negative association was observed between preoperative PROMIS scores and magnitude of improvement at the 6-week postoperative time point (slope=-0.6291, p < 0.001) (Fig. 2). There was no significant association observed at the 12-week (slope=-0.1797, p = 0.3136) (Fig. 3), 6-month (slope=-0.1853, p = 0.3131) (Fig. 4), or 1-year time points (slope=-0.4669, p = 0.0783) (Fig. 5).
4. Other PROM
Statistically significant improvements were observed during the postoperative period for at least one-time point for each score within each subgroup for the 4 other PROMs that were assessed, including VAS arm, VAS neck, NDI, and SF-12 (Table 7). Furthermore, statistically significant differences between each subgroup existed during preoperative evaluations and for multiple postoperative evaluation time points for VAS neck, NDI, and SF-12 (p < 0.05).
DISCUSSION
While cervical surgery outcome evaluations have previously been assessed with “legacy” PROMs such as the SF-12, NDI, and VAS, the next step for increasing accuracy and efficiency in patient assessment is likely to be in the form of CAT metrics such as PROMIS. Though validity of PROMIS in characterizing a patient’s current global health state has been studied and validated by a number of researchers [20-23], others have demonstrated predictive properties of PROMIS [24,25]. In this study, among the 2 samples of individuals having a preoperative PROMIS scores of < 35 or ≥ 35, there were statistically significant differences in the mean improvements at the 6-week and 1-year time period evaluations.
In this assessment, the 2 PROMIS subgroups were divided at a 35.0 cut point based on previously conducted, highly powered studies [19]. Using the 35.0 cut point facilitated the division of 2 subgroups with a statistically significant mean difference in preoperative PROMIS scores. Compared to the PROMIS ≥ 35 group, those with PROMIS scores < 35 had a significantly lower mean preoperative score (42.5 vs. 29.9, p < 0.001) (Table 4). Furthermore, those with lower preoperative PROMIS scores (< 35) were observed to have a larger mean improvement between preoperative PROMIS scores and their evaluations at 6 weeks and 1 year compared to the higher (≥ 35) PROMIS score group. While this difference was statistically significant at the 6-week and 1-year time periods, the comparative mean difference in improvement was not significant between subgroups at 12 weeks and 6 months. Hence, the 2 groups only had a significant difference in PROMIS score improvements at the earliest and latest ends of the evaluation period.
These findings are most relevant in how they might be generalized to support patients with their expectations and experiences during preoperative counseling and throughout recovery. Taking the results of this study, clinicians might be able to identify patients with PROMIS scores of < 35 and reassure them that although their improvement may seem to plateau throughout the mid recovery period, they are likely to still see further recovery toward the end of the recovery period. Likewise, in the patients that began the preoperative period with PROMIS score advantage, it is also important to recognize that such patients are still likely to see improvement throughout the first postoperative year. In the context of this study, both patient groups may see an improvement in global PF as measured by the PROMIS score. Finally, when examining the subgroups by intragroup score, each subgroup was observed to have statistically significant improvements from their mean preoperative score to the mean postoperative score at each timepoint.
This study has several limitations, including the elective surgery patient sample, its retrospective nature, and possible biases in selection and analysis. Evaluation of preoperative PROMIS scores among elective and traumatic patient samples has been observed to affect each subgroup in different ways. An additional limitation that should be considered is that, although fusion rate has been determined, in the majority of cases it was evaluated utilizing X-ray radiographs instead of CT. Confirming boney fusion via radiograph could have led to underreporting of nonunion cases.
As with any retrospective study, selection biases can develop for multiple reasons. Many of the difficulties encountered can be related to possible selection biases. Selection bias can be introduced because of a population that is less generalizable to the greater population. This may occur due to a single institution study design, the investigated population, or confirmation biases among researchers. As with any study focused on outcome measures, including PROMIS, it is often hypothesized that patients who are sicker tend to follow up more frequently than healthy patients. It is difficult to ascertain exactly how loss to follow up would have impacted this patient population since the PROMIS improvement differences were only significantly different at the beginning and end of the observation period. Furthermore, this increasing this study’s observation time would increase the applicability of preoperative PROMIS score and its implications.
A limitation to our study is the assumption that both cohorts of patients will have similar responses to surgical treatment as measured by PROMIS. This assumption may not be true when comparing younger patients who experience acute trauma to older patients with chronic symptoms who are still functionally capable. Further investigation is required to elucidate the temporal effect of symptoms on postoperative PROMIS score improvement. Other limitations may be inherent to the survey. Beyond the requirement for a computer to administer the evaluation, routine behaviors and tasks may not be relatable cross-culturally, and this may hinder the reliability and repeatability of the survey.
Finally, longitudinal evaluations such as PROMIS scoring requires diligent and consistent follow-up. Although the authors exercised their best effort to ensure patients followed up, there was a steady decline in the number of participants that completed each sequential evaluation. As previously stated, this may have occurred due to incentives associated with patients who were sicker (i.e., patients with more severe illness are more eager to follow up). However, one might also consider that sicker patients could have been unable to complete surveys. While there have been a variety of methods established for altering datasets based due to possible effects of selection bias [26], the authors of this study noted the total number of patients at each follow-up (Tables 3-4) and only calculated averages based on the number of observations present at each follow-up. Likewise, changes in scores were not calculated unless the same patient had a score at both evaluated time points.
CONCLUSION
At the early and late evaluations of a 1-year postoperative follow-up, patients with lower preoperative PF scores, as measured by PROMIS, had significantly larger postoperative PROMIS score improvements, i.e., between 6 weeks and 12 months. While lower preoperative PROMIS scores appear to have an inverse relationship with postoperative improvement at the 6-week and 1-year assessments, further observation is required to elucidate if this effect is lessened after the 1-year postoperative time period. Although PROMIS scores can provide a standardized method to evaluate patients before surgery, and throughout their recovery, it also may give clinicians another tool that can be used in the context of a broader clinical picture. Patients with lower preoperative PROMIS scores (< 35) may be counseling regarding the possibly significant changes that are anticipated in their PF during early and late (6 weeks and 1 year) postoperative time periods.