


INTRODUCTION
Full-endoscopic spine surgery is gaining interest as a less-invasive alternative to treat sciatica caused by a lumbar disc herniation [1-4]. An important limitation of these procedures is that they appear to be more difficult to learn than other techniques [5-7]. Especially so for percutaneous transforaminal endoscopic discectomy (PTED) which is a full-endoscopic technique, which removes the disc herniation trough the neuroforamen [8]. This procedure does not only require the surgeon to operate through an endoscopic, but also from a far lateral position which is an unfamiliar approach for most surgeons.
Recently, we published the results of a randomized controlled trial (RCT) showing noninferiority in leg pain reduction of PTED compared to microdiscectomy in treating sciatica [2,9,10]. Furthermore, we showed that PTED appeared to be more cost-effective than microdiscectomy from societal perspective. As these results warrant implementation of PTED as a less-invasive treatment option for sciatica, studies exploring the safety and clinical outcomes of patients during the learning curve are needed. In the beginning phase of our RCT, 3 spine surgeons were trained in performing PTED. In this paper, we present the results of the learning curve analyses.
MATERIALS AND METHODS
1. Trial Design
A multicenter, noninferiority, RCT was conducted at 4 general hospitals in the Netherlands among patients with sciatica caused by lumbar disc herniation. Details of the protocol and study design have been published previously [11]. The study was funded by ZonMw, The Netherlands Organization for Health Research and Development. The trial was initiated and performed without involvements of the industry. The research protocol was approved by the research ethics board of all participating hospitals. All patients provided written informed consent prior to enrollment. The trial was registered at ClinicalTrials.gov (NCT02602093).
2. Enrollment and Randomization
From February 2016 to April 2019 patients were screened and enrolled by spine surgeons. Patients were eligible for the PTED-study if they were between 18 to 70 years of age; had more than 6 weeks of excessive radiating pain and no tendency for any clinical improvement; had an indication for surgery; had magnetic resonance imaging demonstrating a disc herniation with nerve compression with or without concomitant spinal or lateral recess stenosis or sequestration; and had sufficient knowledge of the Dutch language in order to complete forms and follow instructions independently. Exclusion criteria were previous surgery on the same or adjacent disc level; cauda equina syndrome; spondylolytic or degenerative spondylolisthesis; pregnancy; severe comorbid medical or psychiatric disorder (American Society of Anesthesiologists physical status classification > II); severe caudal or cranial sequestration of disc fragments; contraindication for surgery and moving abroad on short notice.
Patients were randomized in a 1:1 ratio to PTED or microdiscectomy using computer-generated variable block sizes (4, 6, or 8), stratified by enrolling center. Blinding of patients was not feasible because of the substantial differences between both procedures (e.g., PTED having an 8-mm incision lateral of the spine and microdiscectomy having an incision of 2–5 cm dorsal of the spine in the midline).
3. Learning Curve Procedure
All trial surgeons were spine-dedicated surgeons who had 8 to 11 years of experience in performing degenerative lumbar surgery. Before the trial, only one of the participating spine surgeons was proficient in performing PTED in the Netherlands [12]. During this study, 3 surgeons (one per center) were trained in performing PTED. Each surgeon attended a hands-on cadaveric workshop on PTED. Afterwards they performed 10 to 20 procedures under supervision of the senior surgeon. Afterwards, they would perform PTED on their own. Based on an educated guess, we assumed the learning curve would take 50 cases per surgeon.
4. Interventions
1) PTED
The full procedure has been published previously [8]. Local anesthesia was administered [13]. An incision was made just above the dorsolateral side of the pelvis, where a needle was set from the incision to the superior articular process of the lower involved vertebrae of the herniated disc. After the needle had reached the superior articular process, a guidewire was inserted. Subsequently conical rods were introduced followed by a drill to enlarge the neuroforamen. Hereafter, an endoscope was introduced within the working channel using an 8-mm cannula. A forceps was used to remove the disc fragments. Patients were treated on an outpatient basis.
2) Microdiscectomy
Microdiscectomy was conducted under general anesthesia. The use of loupe or microscope magnification was optional. A paramedian incision was performed. Following the identification of the lamina, the ligamentum flavum was removed to identify the nerve root and disc herniation. Laminotomy, as well as foraminotomy, was performed, if necessary. For foraminal herniated discs a partial medial facetectomy was performed while for extraforaminal herniated discs, a parafacetal approach was used. Patients were discharged as soon as medically responsible, which was usually one day after surgery.
5. Outcome Measures and Statistical Analysis
A complete overview of the patient-reported outcome measures (PROMs) measured during the PTED-study, along with the statistical analysis plan, have been published elsewhere [2,11]. In brief, the PTED-study was a RCT which established the noninferiority of PTED in leg pain reduction compared to microdiscectomy. The sample size was set at 682 patients and included 150 learning curve cases which were matched with 150 microdiscectomy cases. The PTED learning curve cases were excluded for the primary analysis.
The primary outcome was the visual analogue scale (VAS) for leg pain, measuring leg pain from a 0 to 100 scale [14]. Other outcomes were the Oswestry Disability Index (ODI), the VAS for back pain, VAS for quality of life, the 36-item Short Form Health Survey and 7-point Likert scales on recovery and satisfaction [15,16]. Means and standard deviations were used to present the PROMs, or percentages with odds ratios (ORs) when appropriate. Early cases (first 20) and later PTED cases (> 20) were compared using linear or logistic regression analyses. The learning curve in terms of duration of surgery, was visualized by creating scatter plots and basic control charts. Finally, differences in PROMs between surgeons, were assessed using subgroup analyses. Differences were tested using interaction p-values.
Differences were expressed in 95% confidence intervals (CIs). A p-value lower than 0.05 showed statistical significance, while for the exploratory subgroup analyses a p-value lower than 0.0125 was considered to be statistically significant. The basic control chart was created using Microsoft Excel, while all other analyses were conducted with IBM SPSS Statistics ver. 27.0 (IBM Co., Armonk, NY, USA).
RESULTS
1. Patients
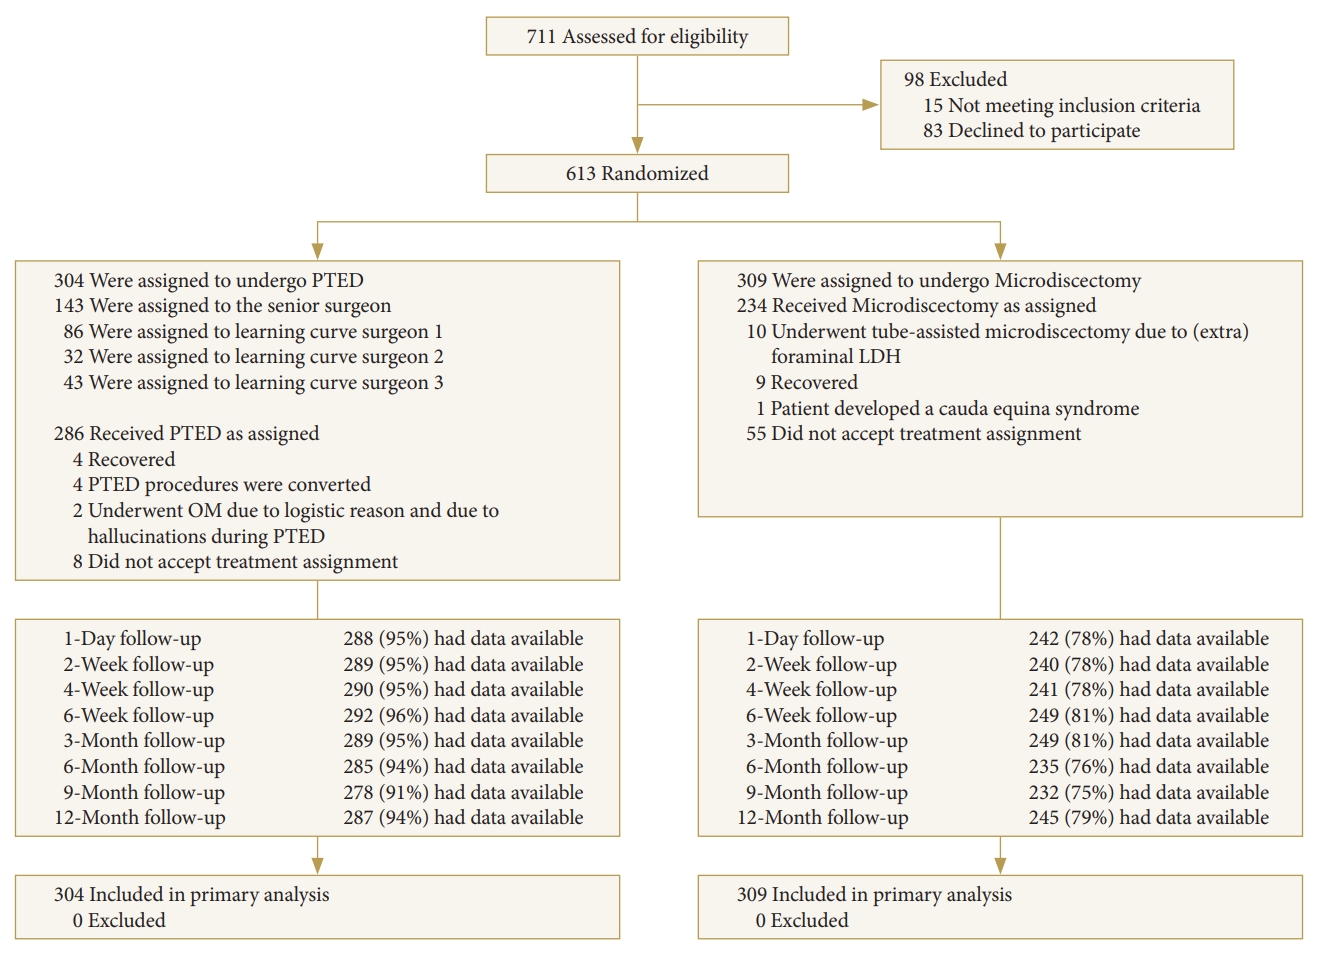
A total of 711 patients were screened for eligibility between February 2016 and April 2019. Of these, 613 were randomized to either microdiscectomy (N=309) or PTED (N=304). At 12 months after surgery, 87% of the patients had outcome data available (Fig. 1). Of the patients assigned to PTED, 143 (47.0%) were assigned to the senior surgeon, 86 (28.3%) to LC surgeon 1, 32 (10.5%) to LC surgeon 2, and 43 (14.1%) to LC surgeon 3.
Table 1 gives an overview of surgeon characteristics and baseline demographics of the patients. In general, baseline demographics such as age, body mass index, duration of sciatica, paid employment, level of disc herniation and the PROMs were comparable between groups. Some differences between groups appear in gender, smoking status, and preference for PTED.
2. Surgical Outcomes
Fig. 2 gives an overview of the surgical learning curve per surgeon through scatter plots and basic control charts. LC surgeon 1 appears to have a stable duration of surgery throughout the cases with 2 clear outliers, both caused by cases during which PTED was converted to microdiscectomy. LC surgeon 2 shows a trend towards a longer duration of surgery, while LC surgeon 3 shows a decrease in surgery duration.
Table 2 gives an overview of surgical outcomes and complications. Duration of surgery was of statistically significant longer duration for the learning curve surgeons compared to the senior surgeon performing PTED (p<0.001) and surgeons performing microdiscectomy (p<0.001). Furthermore, estimated blood loss was less for all surgeons performing PTED and microdiscectomy (p<0.001). Complications such as dural tears, nerve root injuries and wound infections, did not occur in the PTED-group and appear to be lower compared to the microdiscectomy group. Repeated surgery within 1 year of surgery was statistically significantly higher between LC surgeon 1 and both the senior surgeon (p<0.001) and the microdiscectomy group (p<0.001). LC surgeon 3 had a higher repeated surgery rate than the other groups (11.6% vs 2.1% to 5.6%), but this was not statistically significant.
3. Patient-Reported Outcomes
Table 3 gives an overview of the PROMs comparing the early cases (first 20) of the LC surgeons with the later cases. Except for back pain which showed a higher VAS (8.0; 95% CI, 0.5–15.4) in favor for the later cases, there were no statistically significant differences in PROMs between the early and late cases. There were also no statistically significant differences between the early cases and the microdiscectomy group. When the microdiscectomy group was compared to the later cases, the later cases showed statistically significant more favorable outcomes in terms of leg pain reduction (-6.2; 95% CI, -11.2 to -1.3), ODI (-4.5; 95% CI, -7.7 to -1.4), back pain (-5.3; 95% CI, -10.0 to -0.6), quality of life (5.1; 95% CI, 1.7–9.1), recovery from symptoms (OR, 1.8; 95% CI, 1.2–2.6), satisfaction with change in symptoms (OR, 1.5; 95% CI, 1.1–2.3).
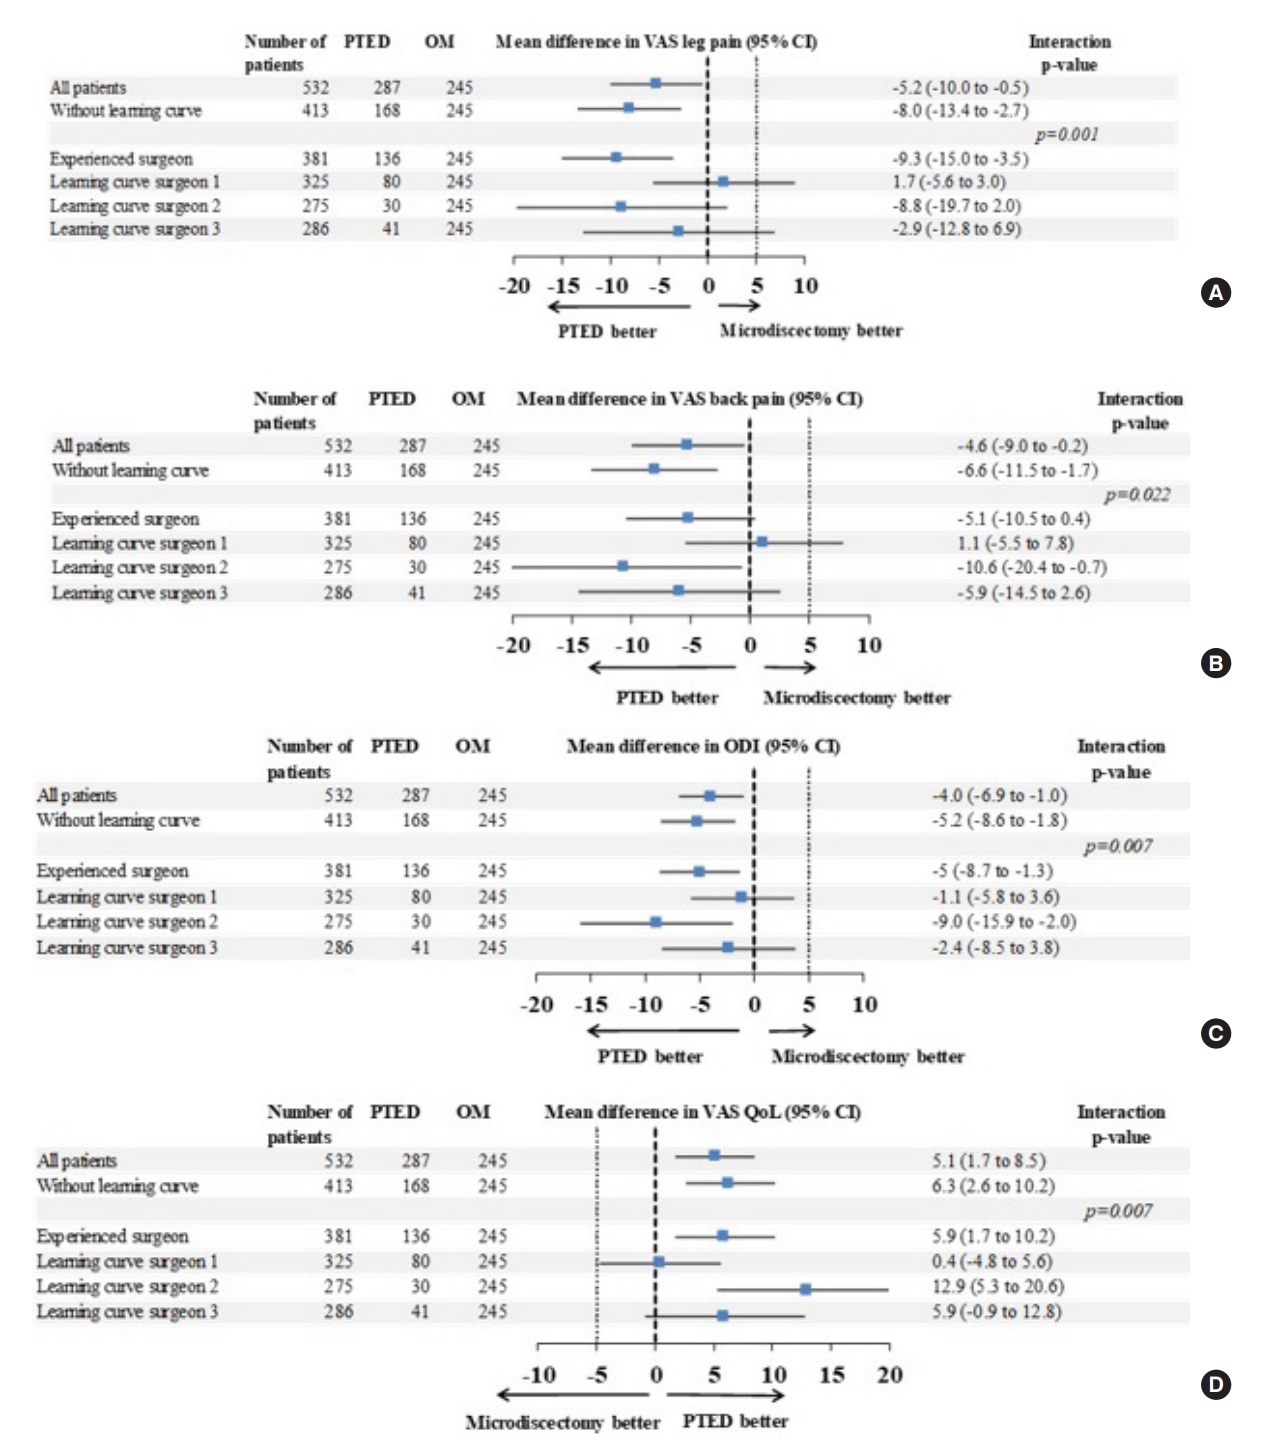
Fig. 3 shows the subgroup analyses comparing the PROMs of the senior surgeon and the LC surgeons, compared to the microdiscectomy group. Overall outcomes with or without the learning curve showed small differences in favor of the PTED-group on all outcomes. In general, all subgroup analyses showed a statistically significant difference between the experienced and LC surgeons on the VAS leg pain, ODI, and VAS QoL, but not the VAS back pain. Outcomes of LC surgeons 1 and 3 showed no differences between groups, while some outcomes of LC surgeon 2 and the senior surgeon showed more favorable outcomes in the PTED-group.
DISCUSSION
This study describes the clinical outcomes of the learning curve of the largest randomized study conducted on full-endoscopic versus open microdiscectomy for sciatica. This is the first study to compare the outcomes of the learning curve of PTED in multiple surgeons with the outcomes of microdiscectomy in a prospective randomized manner. For this study, 3 spine surgeons underwent training in PTED and performed their first cases under supervision of an experienced surgeon. Afterwards, they started performing PTED independently. Complications were comparable between the LC surgeons and the senior surgeons. All LC surgeons, however, had a longer duration of surgery and 2 out of 3 of the LC surgeons had a substantially higher rate of repeated surgery within 1 year of surgery. Except for back pain, clinical outcomes appear to be comparable between the early PTED cases and the later PTED cases. Moreover, clinical outcomes of the early cases, showed no statistically significant differences compared to the outcomes of microdiscectomy, enforcing that aside from a higher risk of repeated surgeries, surgeons naïve to PTED can achieve satisfactory PROMs during their learning curve. Results of the subgroup analysis, however, shows there is a significant heterogeneity in treatment outcomes between surgeons. It is to be noticed, that most if not all statistically significant differences, may not reach established minimally clinically important difference thresholds [17,18].
Some previously published studies have tried to assess the surgical learning curve of full-endoscopic surgery for sciatica [5-7,19]. In the literature, learning curves can be found consisting of 20 to 54 cases, but there is also evidence that the results may even further improve after these cases. Perhaps these first 20 to 54 cases are more considered to be a learning curve in order to achieve satisfactory results. In comparison, another retrospective study assessing the learning curve of microendoscopic decompression for lumbar spinal stenosis, showed that based on blood loss, the learning curve plateaus after the 30th case [20]. Based on the duration of surgery, however, there seems to be a progressive reduction over 480 cases, with the biggest reduction during the first 100 cases. All of these studies, however, are retrospective analyses which mostly involved only 1 surgeon.
Some limitations have to be acknowledged. First are the limitations adherent to the PTED-study [1,2,11]. First is that the study was not blinded due to the nature of both procedures. Furthermore, there was a high preference for PTED among the patients, which might have impacted the results. Nevertheless, results corrected for patient preferences appeared similar to the uncorrected results [2]. Another limitation is the power of the post hoc subgroup analysis. Because 4 subgroup analyses were conducted, concerns on the loss of power are justified. We tried, however, to correct this by adhering a p-value of 0.0125 for the subgroup analyses. Furthermore, the PTED-study was overpowered due to the extra inclusion of controls. This increases the validity of our study results. Nevertheless, almost all subgroup analyses showed statistically significant differences which would not reach established minimum clinically important differences. An increase in statistical power would unlikely lead to other conclusions. Another limitation of this study is that we did not present results on the difficulties surgeons had while performing the procedures. For instance, median or migrated disc herniations might have been more difficult to be performed by surgeons and would result in longer durations of surgery. However, this might not be reflected in clinical outcomes as our previous study has shown [2].
As the study results show that learning is safe among spine surgeons, this data can be used to inform surgeons on adopting endoscopic surgery. Surgeons should be aware that in this study, 3 spine-dedicated surgeons were trained with 8 to 11 years of clinical experience and the learning curve may be different for surgeons of other tenure. Perhaps residents, who are more exposed to endoscopic surgery will be more easily able to adapt these procedures. On the other hand, experienced surgeons may find it more difficult to learn full-endoscopic procedures as it will be a new procedure they have to learn after performing other open or MIS procedures for long time periods. Another implication is for informing patients when a surgeon naïve to the procedure is performing his first cases. A longer operation duration would not necessarily affect the patients, but an increased risk for revision surgery will. Study results show that patients should be informed that their clinical outcomes may be comparable 1 year after surgery, but at the same time, they have a higher risk for undergoing a revision procedure compared to when they would undergo full-endoscopic surgery by an experienced surgeon or microdiscectomy.
CONCLUSION
In conclusion, PTED appears to be safe to be adopted by surgeons naïve to the procedure when they are supervised by an experienced senior surgeon. Duration of surgery and risk of repeated surgery are increased during the learning curve, but patient-reported outcomes of the early PTED cases are similar to the outcomes of later PTED cases, and to the outcomes of microdiscectomy cases. This study underlines the need for an experienced mentor for surgeons to safely adopt PTED.