


INTRODUCTION
Ossification of the posterior longitudinal ligament (OPLL) of the cervical spine is a common cause of spinal cord dysfunction, which is characterized by progressive spinal stenosis and spinal cord compression [1-4]. In the elderly, OPLL can lead to severe neurological dysfunction, which may manifest as hyperreflexia, clumsy gait, paresthesia, decreased strength, and signs of radiculopathy [5,6]. Some patients with OPLL-caused degenerative cervical spinal stenosis never had symptoms or signs of myelopathy; in a cadaver study that included both myelopathy and OPLL, 9% of patients over 70 years old had evidence of obvious cervical spinal stenosis after death [7-9]. Despite the high prevalence rate, clinical experience indicates that only a small number of patients with these findings have symptomatic myelopathy and require surgical decompression. Despite the low degree of ossification, some patients develop myelopathy. OPLL-induced spinal canal stenosis can affect multiple vertebral segments, and the degree of compression in each segment influences the severity of myelopathy [10].
Myelopathy is caused by several factors, including (1) the formation of the spinal canal and intervertebral foramen, (2) pathological invasion, (3) biomechanical effects, and (4) circulatory dysfunction. Furthermore, inflammation is a mechanism of disc degeneration in patients with cervical spondylosis (CSD) [11-15]. The pathogenesis of OPLL-induced myelopathy cannot be explained solely by static spinal cord compression in OPLL patients; dynamic factors amplify the static effect of spinal canal stenosis caused by ligament ossification [16,17]. According to Matsunaga et al. [18], pathological compression of the ossified ligament causes myelopathy above a certain critical point, while dynamic factors cause it below that critical point. Previous research has investigated the effect of OPLL on myelopathy severity, but mainly static factors, or analysis from the whole cervical level, make it difficult to identify the clinical factors that best predict the severity of myelopathy [19].
In this study, we aimed to examine the relationship between imaging data and clinical symptoms of cervical OPLL patients, as well as to assess the morphology, thickness, stability, and other pathogenic factors of ossification foci at each cervical segment. The association of dynamic and static factors with responsible segments of OPLL-induced myelopathy was investigated. Furthermore, we investigated whether the classification of increased signal intensity (ISI) by magnetic resonance imaging (MRI) in OPLL patients reflects the severity of symptoms.
MATERIALS AND METHODS
1. Patient Demographics
This study reviewed 389 patients with cervical OPLL diagnosed in the clinic from 2012 to 2014. Initially, the findings of radiographs and computed tomography (CT) scans of the cervical spine were used to diagnose all patients at our university hospital. Demographic information, such as gender and age, was obtained from electronic medical records. The exclusion criteria are listed as follows: (1) Patients suffering from stroke or neurological disease, cardiovascular disease, or thromboembolic disease. (2) Patients with a history of spinal and nervous system trauma, spinal deformity, cervical spine surgery, bone fractures, or cancer. (3) The absence of imaging data or clinical data was excluded. Therefore, the study eventually included 163 patients (108 men and 55 women; mean age, 66.5 years; range, 37–90 years). Ossification type: continuous in 26 cases, segmental in 29 cases, mixed in 81 cases, and localized in 27 cases. The Toyama University Hospital’s Ethics Committee reviewed and approved the human-participant studies (R2015003). The patients/participants provided written informed consent to partake in this study.
2. Radiological Measurements and Clinical Results
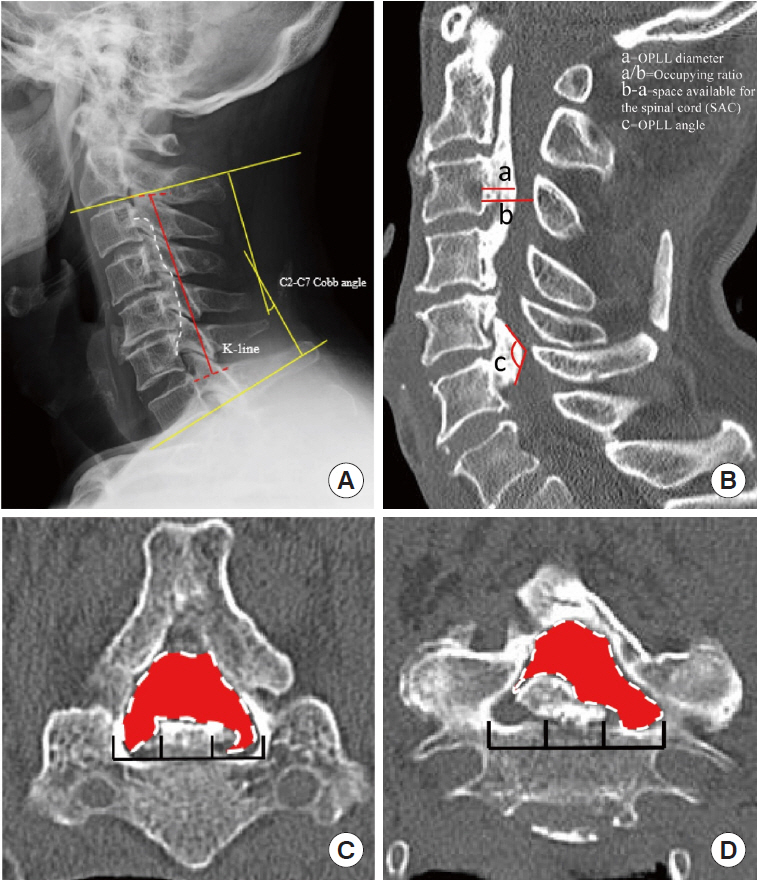
Based on a lateral plain radiograph of the cervical spine, the K-line and the C2–7 Cobb angle were evaluated as static factors (Fig. 1A). The K-line was characterized as a straight line connecting the midpoints of the spinal canal at C2 and C7 on lateral radiographs [20]. The Cobb angle was calculated by drawing parallel lines from the lowest endplate of the most superior vertebral level (C2) to the lowest endplate of the lowest vertebral level (C7). The parallel lines were then perpendicularly drawn, with the angle of intersection equal to the Cobb angle [21]. We examined the cervical spine’s physiological curvature as well as the relationship between the ossified ligament and the spinal canal.
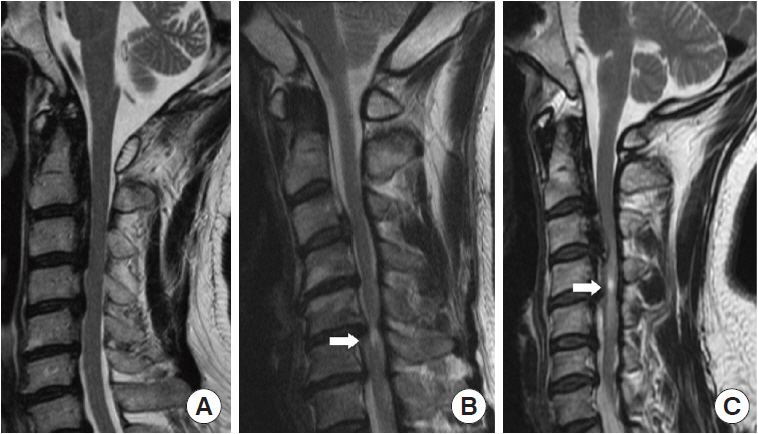
In the midline section of sagittal CT, we measured OPLL diameter, space available for the spinal cord (SAC), and occupation ratio (OPLL thickness/osseous anteroposterior diameter) of each segment from C2–7 [17]. OPLL distribution at each vertebral body and intervertebral disc level was recorded to quantify posterior longitudinal ligament hyperostosis, and the number of levels where OPLL was present was calculated to calculate the ossification index (OP-index). Furthermore, we measured the OPLL angle, which is defined as the angle formed by 2 tangents to the ossification foci (Fig. 1B). The axial ossified pattern can be divided into 2 types: central and lateral. The central type was defined as having the most occupied portion of the OPLL tip within the middle one-third of the width of the vertebral canal, while the lateral type had the most occupied portion of the OPLL tip outside the middle one-third of the width. Furthermore, we measured the available space in the narrowest axial image, which we defined as the minimum axial bone space (Fig. 1C). Ossification of the intervertebral space was characterized as “Bridge-Formation” and the number and proportion of bridges formed per segment were measured. Furthermore, all patients underwent high-resolution MRI at the same time. In sagittal T2 images, the ISI of the spinal cord at the narrowest level was classified into 3 groups according to Yukawa et al. [22]: grade 0, none; grade 1, light (obscure); and grade 2, intense ISI was defined to be similar to the signal from the cerebrospinal fluid (Fig. 2).
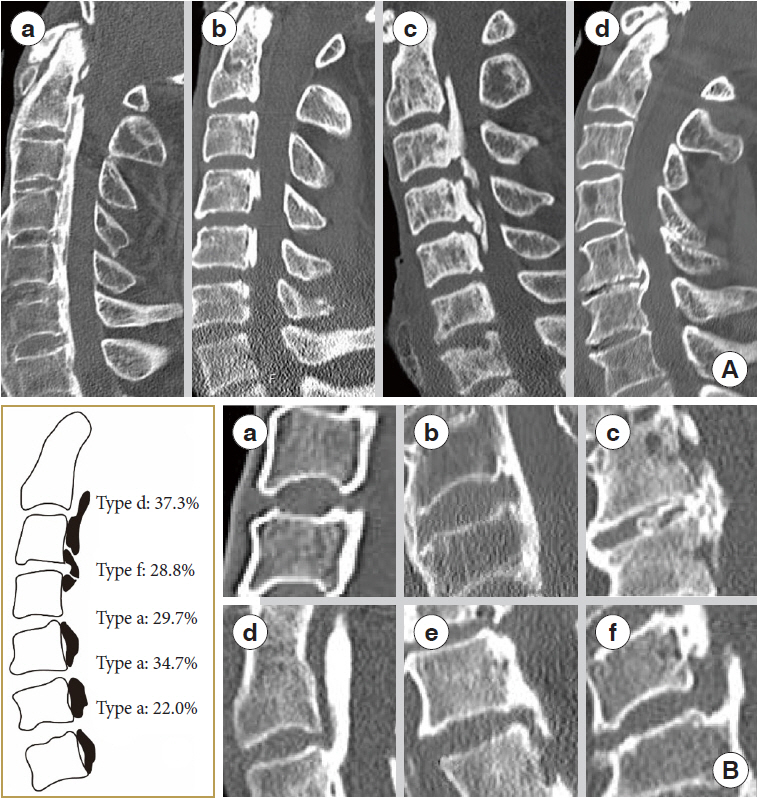
Based on static factors, we used previous criteria to categorize ossification into the following types: (a) continuous, (b) segmental, (c) mixed, and (d) localized based on cervical spine lateral radiography [23] (Fig. 3A). Based on the morphology of different segments in patients, we classified them into 6 types based on whether they were stable or not. The stable form is shown as follows: (a) nonbridge formation, (b) stable plate, (c) stable beak; and unstable forms included (d) unstable upper-plate, (e) unstable lower-plate, (f) unstable-beak (Fig. 3B).
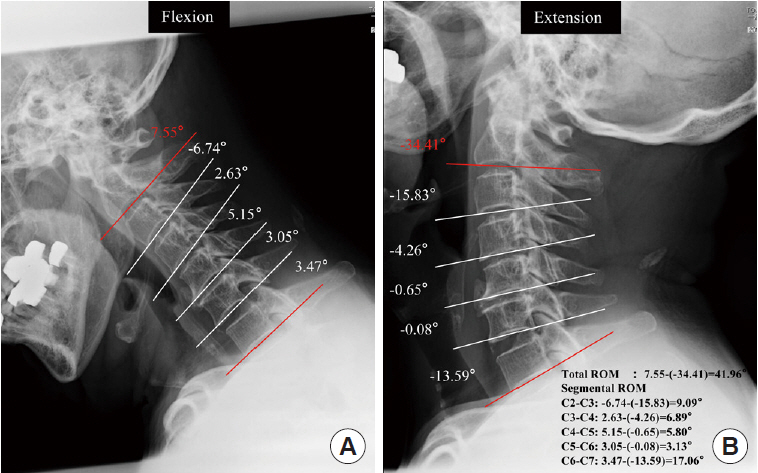
Dynamic factors were assessed using the angle between each segment of the lower edge of C2 to C7 on a plain radiograph, and the differences between the maximum flexion and extension positions were obtained and expressed as negative extension and positive flexion values. The angle between the lower endplates of the vertebrae at the peak of the OPLL in the flexion-extension lateral view was defined as the segmental range of motion (ROM). Then, in the sagittal position, we defined the local angle as the ROM at the narrowest segment (Fig. 4). Finally, the Japanese Orthopaedic Association (JOA) score was used to determine the severity of OPLL-induced myelopathy [24]. OPLL patients were divided into 2 groups: those with myelopathy (M) (JOA score < 17) and those without myelopathy (WM) (JOA score=17) based on the JOA score. Based on the severity of symptoms, the M group was divided into 2 groups: mild myelopathy (12 ≤ JOA score < 17) and moderate myelopathy (JOA score < 12). Two independent raters performed all radiographic and measurement procedures twice in a 1-month interval.
3. Statistical Analysis
Data are presented in the form of the mean (standard deviation [SD]; range) or mean (SD). Continuous data were compared using the unpaired t-test, while categorical data were compared using Fisher exact test. Variables associated with p < 0.05 on univariate analysis were considered candidate risk factors in multivariate analysis. A multivariate logistic regression analysis was used to identify factors associated with OPLL patients’ myelopathy.
RESULTS
1. Patient Demographics and Clinical Characteristics
Patients were divided into the M group (n = 118) and the WM group (n = 45) based on the JOA score. The JOA score in the M group was 12.4 ± 3.0 and 17 in the WM group. Age, sex, and body mass index (BMI) had no significant effect on clinical outcomes. Our findings revealed that the OPLL type (p = 0.153) and morphological type (p = 0.533) were similar in the 2 groups (Table 1). No statistical difference was found between the 2 groups with ossification, the OP-index of the cervical spine was 7.4 ± 2.3 in the M group and 7.8 ± 2.7 in the WM group (p = 0.310). The proportion of lateral types was significantly higher in the M group (41.5%) than in the WM group (24.4%) (p = 0.043). K-line (-) patients were more prevalent in the M group (27.1%) than in the WM group (15.6%), while there was no statistical significance between the 2 groups (p = 0.152). Among the 2 groups, group M had more “Bridge-Formation” of the intervertebral spaces in the lower cervical spine, with C5/6 (57.6% vs. 40.0%) and C6/7 (49.2% vs. 28.9%) segments demonstrating statistical significance (p < 0.05). Furthermore, there were no statistically significant correlations found between other clinical outcome scales and imaging parameters.
2. Comparison of Radiological Measurements of the Cervical Spine Between the M and WM Groups
Table 2 summarized the contrast measured by x-ray and CT images of the 2 groups respectively. The results showed that among the static factors, the M group’s minimum SAC (5.3 ± 1.7 mm) was significantly lower than the WM group’s (6.5 ± 1.9 mm) (p < 0.001), and the M group’s minimum axial bone space (155.3 ± 34.7 mm2) was also lower than the WM group’s (183.7 ± 47.6 mm2) (p < 0.001). Although the maximum occupied ratio was higher in the WM group (p = 0.005), there was no significant difference in the maximum diameter of OPLL or the minimal sagittal angle between the 2 groups (p = 0.085). The C2–7 Cobb angle of the cervical spine in the M group (10.3° ± 8.4°) was less than that in the WM group (16.8° ± 11.5°), indicating that the effects of ossification straightened the cervical physiological curvature in myelopathy patients (p < 0.001). Among the dynamic factors, the total ROM of patients in the M group (27.0° ± 13.4°) was lower than that of the WM group (35.7° ± 14.6°) (p < 0.001), and the local ROM was lower as well (p = 0.034).
Following the multivariate analysis, minimal SAC (odds ratio [OR], 0.006; 95% confidence interval [CI], 0.000–0.853; p = 0.043), (C2–7) Cobb angle (OR, 0.936; 95% CI, 0.895–0.980; p = 0.004), total ROM (OR, 0.958; 95% CI, 0.926–0.991; p = 0.013), and local ROM (OR, 0.888; 95% CI, 0.802–0.983; p = 0.022) were measured as independent predictors of myelopathy (Table 3).
3. Comparison of Radiological Measurements of Each Segment Between the M and WM Groups
We compared the measurements of the 2 groups of patients at each segment of the cervical spine. The distribution of morphological type differed significantly among the 815 segments (Fig. 3B). In the M group, C2–3 (37.3%) are mostly of the unstable upper-plate type, C3–4 are mostly of the unstable-beak type (28.8%); C4–5, C5–6, and C6–7 are mostly of the nonbridge formation type, whereas in the WM group, C3–4 is mostly of the nonbridge formation type (32.4%). Interestingly, we discovered that in the M group, the minimum SAC (4.7 ± 1.1 mm) of C3/4 was significantly lower than in the WM group (6.5 ± 1.2 mm) (p < 0.001). Furthermore, the minimum axial bone space of C3 was less than that of the WM group (p = 0.018). The maximum occupation ratio was greater than that of the WM group (p = 0.015), indicating a statistically significant difference. The ROM in the C3/4 segment M group (7.2° ± 4.2°) was greater than that in the WM (5.5° ± 3.6°) group (p = 0.140). In the M group, the minimum SAC of the C2/3 segment is smaller than that of the WM group (p = 0.024), and the minimum axial bone space of the C4/5 segment in the M group is smaller than that of the WM group (p = 0.007). Furthermore, the C5/6 segmental ROM is smaller than that of the WM group (p = 0.015). It means that in the M group, the upper cervical spine has greater ROM than the WM group, while the lower cervical spine is more stable than the WM group (Table 4).
4. Correlation Between Static and Dynamic Factors of the Cervical Spine and Clinical Outcomes
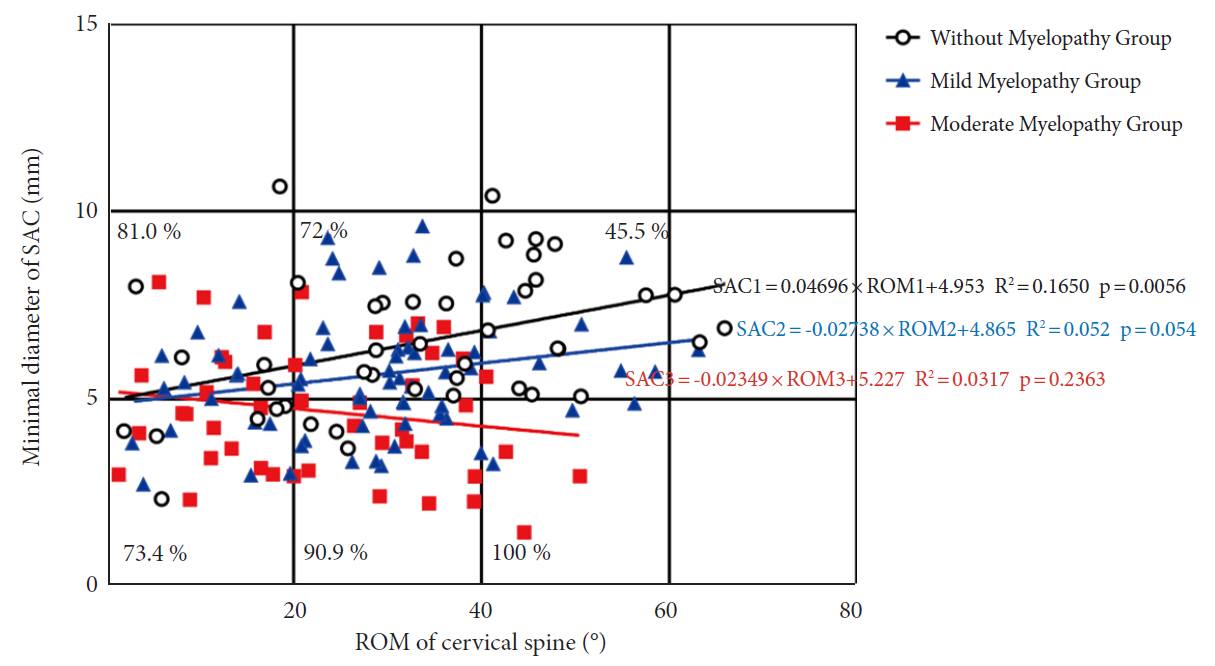
According to their JOA level, we divided 163 patients into 3 groups: those without myelopathy, those with mild myelopathy, and those with moderate myelopathy. A positive correlation trend was observed between the minimum SAC and total ROM (Fig. 5). The slope of the without myelopathy group was the largest (R2= 0.1650; p = 0.006), followed by patients with mild myelopathy (R2= 0.052; p = 0.054) and patients with moderate myelopathy had the lowest slope (R2= 0.03173; p = 0.236). The incidence of myelopathy increased with increasing ROM at a minimum SAC of less than 5 mm, with 73.4% incidence at 0°–20° compared to 90.9% at 20°–40°, and 100% at 40°–60°. When the SAC was greater than 5 mm, the incidence rate of myelopathy decreased with increasing total ROM, with 81.0% incidence at 0°–20° compared to 72% at 20°–40° and 45.5% at 40°–60°.
5. MRI Signal Intensity Classification in Cervical OPLL
Out of the M group patients, 73 were found to have ISI on the MRI scan, with 63 patients (53.4%) in grade 1 and 10 patients (8.5%) in grade 2. There were 7 patients (15.6%) in grade 1 and 1 patient (2.2%) in grade 2 among the WM group (p < 0.001). The JOA score (grade 0, 14.7 ± 2.9; grade 1, 12.8 ± 3.2; grade 2, 10.7 ± 3.8 points) decreased with increasing ISI grade (p < 0.001). Simultaneously, as ISI increased, the minimal SAC (p < 0.001) and minimum axial bone space (p < 0.001) gradually decreased, while the maximum occupation ratio (p < 0.001) gradually increased. However, age, gender, BMI, (C2–7) Cobb angle, total ROM, and local ROM were not different in patients in the 3 grades (Table 5).
DISCUSSION
A variety of factors, including static compression and dynamic factors, affect OPLL patients who develop myelopathy. Static compression of the spinal cord by the OPLL is the most important factor contributing to the development of myelopathy, and from the sagittal section, the degree of stenosis of the spinal canal determines the severity of the myelopathy. It is also similar in the axial section, the proportion of lateral type in the axial image was found to be negatively correlated with the incidence of myelopathy in this study. Therefore, the lateral type may indicate that patients with cervical OPLL are more likely to develop severe myelopathy. Our findings also showed that the amount of available space in the sagittal and transverse sections of the spinal canal (minimum SAC, minimum axial bone space, maximum occupation ratio) was an influential factor affecting the occurrence of myelopathy in OPLL patients.
Although larger ROM may theoretically be more likely to cause myelopathy, numerous factors may influence the patient’s flexion and extension activities during a clinical examination, including symptoms, curvature of cervical spine, cervical muscle group, degeneration of cervical small joints, etc [25,26]. Mixed factors can result in different manifestations in patients, as our findings show. Matsunaga et al. [27] examined the cervical spines of OPLL patients and discovered that all patients with SAC below 6 mm developed myelopathy, but none with SAC above 14 mm. This suggests that the static compression factor preferentially promotes the development of myelopathy. They also found that when SAC was between 6 mm and 14 mm, ROM was positively related to the development of myelopathy, indicating that this dynamic factor played a role. A national multicenter prospective study with clear inclusion criteria was designed, and they discovered that more than 60% of spinal canal stenosis caused by OPLL was associated with myelopathy [28]. However, in contrast to previous studies, we found that patients with myelopathy had less total and local ROM than patients without myelopathy. This difference was statistically significant after multivariate logistic regression. According to Luo et al. [29], ossification of the spinal intervertebral space will limit the vertebral body’s ROM. Furthermore, patients with OPLL will also have reduced cervical flexion and extension activities due to myelopathy. This may result in a reduction in total ROM and local ROM.
Cervical spine mobility does not always increase the risk of myelopathy. Although the spinal canal had been severely invaded, some patients did not exhibit symptoms of myelopathy [30,31]. Fujiyoshi et al. [17] studied 27 patients with OPLL of the cervical spine but no clinical symptoms of myelopathy, possibly related to severely limited cervical mobility. In contrast to previous findings, there was no clear boundary on the map between the M and WM groups. We examined total ROM about minimal SAC in patients with myelopathy, using linear regression suggesting that the more severe the myelopathy, the lower the slope. Although total ROM was lower in the M group compared to the WM group, the incidence of myelopathy was positively correlated with total ROM when the minimum SAC < 5 mm, while when SAC > 5 mm, the incidence rate of myelopathy decreased, which may be affected by the confounding factors of the overall ossification level of the cervical spine. The cervical spine may gain more from increased mobility when the minimum SAC is > 5 mm in our patients.
Because OPLL is a 3-dimensional (3D) disease rather than a 2-dimensional disease, segmental factors can influence myelopathy development [32]. According to Saito et al. [33], segmental ROM at the site of preoperative OPLL is an independent predictor of adverse outcomes. Therefore, we investigated the relationship between C2–7 myelopathy incidence and the morphology of each segment, the degree of spinal stenosis, and the ROM of each segment. As a result, C3/4 segment patients had more severe spinal canal stenosis and a greater ROM than asymptomatic patients. This suggested that dynamic and static compression at C3/4 could contribute to myelopathy pathogenesis. According to Yi et al. [34], CSD with dizziness is more prevalent among patients with grade C3/4 CSD, instability on C3/4, and Miyazaki grade IV on C3/4. Tomii et al. [35] also considered patients with cervical spondylotic myelopathy (CSM) to be elderly, and dynamic factors (hypermobility) at the C3/4 level contribute more to the main cause of CSM than static factors. In general, the C5–6 level receives the most load during cervical exercise. In older patients, cervical and/or lower cervical spine mobility is already limited, resulting in an overload of the upper cervical spine. The M group had less cervical ROM (C5/6, C6/7) than the WM group and more ranges of motion (C2/3, C3/4) in the high cervical region. This suggests that upper cervical region instability may contribute to the development of OPLL myelopathy.
ISI of the spinal cord on T2-weighted MRI is frequently seen in OPLL patients. The relationship between ISI classification and myelopathy severity is still debatable. Some studies have found that the postoperative prognosis of ISI patients is poor, but others have found no link between these factors [22,36,37]. The study’s findings show that ISI grading is related to the severity of myelopathy and the static factors of the spinal canal (minimum SAC, maximum occupancy ratio, minimum axial bone space), indicating that ISI is related to long-term spinal cord compression. According to the data, mild ISI is associated with mild neuropathological changes in the spinal cord, indicating a higher recovery potential, whereas severe ISI is associated with severe changes and a lower recovery potential. As the disease progresses, spinal cord signal intensity increases from none to mild ISI and then to severe ISI [38,39].
The current study had several limitations. The study was retrospective and cross-sectional, with a small number of patients from a single institute participating. To validate our findings, a prospective study with larger sample size, frequent observation periods, and multiple time points may be required. Secondly, we did not include 3D-CT, dynamic CT, or MRI for retrospective reasons, and we need to use spinal cord-evoked potentials to diagnose and classify the level of responsibility, which will improve our accuracy. Third, the disease course of the patients must be considered in the study, in addition to prospective follow-ups. More research into this topic is planned for the near future. However, the current study may offer a more comprehensive understanding of the segmental factors that contribute to myelopathy caused by cervical OPLL.
CONCLUSION
Our findings show that minimal SAC, maximum OPLL diameter, total ROM, and local ROM are related to the severity of OPLL myelopathy. The development of myelopathy in OPLL is linked to upper cervical instability and stenosis, specifically C2–3, and C3–4. The incidence rate of myelopathy does not always increase with the increase of ROM. It is more profitable when the minimum SAC > 5 mm. To provide better clinical treatment for asymptomatic or minimally symptomatic OPLL patients we must improve our understanding of the risk factors for myelopathy in OPLL patients.