


INTRODUCTION
Lumbar spine surgery may be considered in some spinal disorders if conservative treatment has not satisfactorily relieved symptoms [1-3]. Most patients undergoing lumbar spine fusion (LSF) have a background of long-standing and disruptive back pain, which may decrease the activation of the paraspinal muscles [4] and lead to multifidus atrophy [5]. During posterior LSF surgery, the detachment and retraction of the lumbar spine may lead to further impairment in the functioning of other paraspinal muscles [6-8].
According to previous studies, low levels of trunk muscle strength per body weight and abnormal extensor/flexor strength balance, in which the flexor muscles are stronger than the extensors, have been identified in patients with chronic low back pain [9] as well as in those who have undergone LSF [10]. Keller et al. [11] reported a decrease of 19% in isokinetic trunk extension strength after LSF at the 1-year follow-up compared to the preoperative value. Tarnanen et al. [12] also found low isometric trunk flexion and extension strength levels in both genders before surgery and three months after LSF.
However, the understanding of muscle function after LSF remains limited. Therefore, this study evaluated the changes in maximal trunk muscle strength after LSF in the 12-month postoperative follow-up compared to preoperative strength. In addition, factors associated with strength levels at 12 months were examined.
MATERIALS AND METHODS
This was a prospective longitudinal follow-up study with physical assessments before surgery and 12 months after. The study was conducted in Tampere University Hospital and Central Finland Central Hospital (Finland). Between January 2008 and December 2009, 253 consecutive patients with different types of spinal disorders undergoing elective LSF surgery were enrolled. Exclusion criteria were spinal fracture, malignant causes of low back pain, and severe psychiatric disorders or other limitations in mental condition, such as dementia. Of all of the patients, 10 were excluded from the study due to the exclusion criteria, 21 had missing preoperative data, and 28 had missing postoperative data. The final sample size was 194 (77%). The present study obtained ethical approval from the Ethics Committees of Tampere University Hospital and Central Finland Central Hospital, Finland. Informed consent from all the study participants was received.
The surgical procedure was instrumented posterolateral fusion (PLF) with or without posterior lumbar interbody fusion. PLF was performed using a midline incision; the muscles were detached from the spine and retracted during the operation. Transpedicular fixation was placed between the fused segments. Decompression was performed to relieve compression of the nerve roots and interbody fusion was added if needed. Transverse processes were decorticated and either an autograft from the iliac crest, removed lamina and allograft bone, or bone substitute, was placed bilaterally. Surgeons from both study centers performed part of the LSF surgeries together.
Postoperatively, the patients were advised to avoid continuous sitting longer than 30 minutes at a time and avoid extreme trunk flexion and extension during the first 4 weeks after surgery. Six weeks postoperatively the participants were advised to begin daily walking and to perform light home exercises for their trunk muscles and lower limb stretches. Three months postoperatively, in addition to daily walking, light trunk muscle, stretching, and balance exercises were advised to be performed 3 times a week at home.
1. Outcome Measures
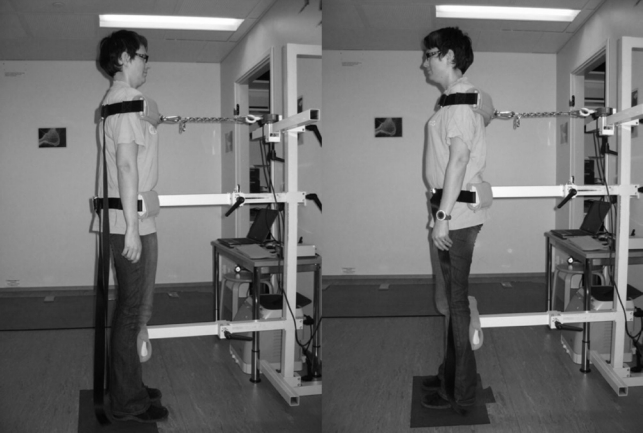
Strength assessments were conducted before the surgery and 12 months postoperatively. The maximal isometric strength of the trunk flexors and extensors was measured using a strain-gauge dynamometer and analyzed with a computer program (Isopack, Newtest, Oulu, Finland) (Fig. 1). The isometric strength test was performed in a standing position, with 20 cm between the feet. The pelvis was fixed against a metal support from below the iliac crest and a harness was placed around the chest just under the armpits. The harness was attached with a metal strain to the strain-gauge dynamometer horizontally. The patients performed 2 maximal isometric contractions, and if the result improved more than 10%, they performed a third contraction. The best result was used in the analysis. The absolute strength levels are expressed in Newtons (N) (10 N=1.02 kg). The extension/flexion (E/F) strength ratio was calculated to quantify the possible imbalance between these 2 antagonist muscle groups.
In addition, socio-demographic data, the amount of leisure time engaged in physical activity (minutes/wk), low back pain, and leg pain intensities during the prior week were obtained using questionnaires. Background data, such as sex and age, and clinical data, such as diagnosis, fusion length, and pain duration before the surgery, were collected from the spine database.
2. Statistical Analysis
Descriptive data are presented as means with standard deviation (SD) or with 95% confidence intervals (95% CI), counts (n) with percentages (%), or medians with interquartile ranges (IQR). Analyses were performed using the normal t-test for normally distributed continuous variables, the bootstrap-type t-test for skewed continuous variables, the chi-square test with dichotomous variables, or the Mann-Whitney U-test for categorical variables. Univariate and multivariate linear regression analyses with the forward stepwise method were performed to investigate the factors associated with the extension and flexion muscle strength levels at the 12-month follow-up.
RESULTS
The mean┬▒SD age of all participants was 61┬▒12 years, body weight 78┬▒15 kg, and the median (IQR) duration of low back pain before the LSF was 31 months (18ŌĆō66 months) (Table 1). The majority of the participants (66.5%) were women. Degenerative spondylolisthesis (71%) was the major diagnostic group; the other groups are listed in Table 1. The women were older and had higher preoperative leg pain intensity than the men (Table 1). The mean low back pain intensity during the previous week decreased from preoperative 63┬▒27 to 25┬▒26 mm in the 12-month follow-up (p<0.001) and the leg pain from 63┬▒26 to 27┬▒27 mm, respectively (both p<0.001). The average leisure time physical activity before surgery was 254┬▒294 minutes/wk and at the 12-month follow-up was 291┬▒373) minutes/wk (p=0.013).
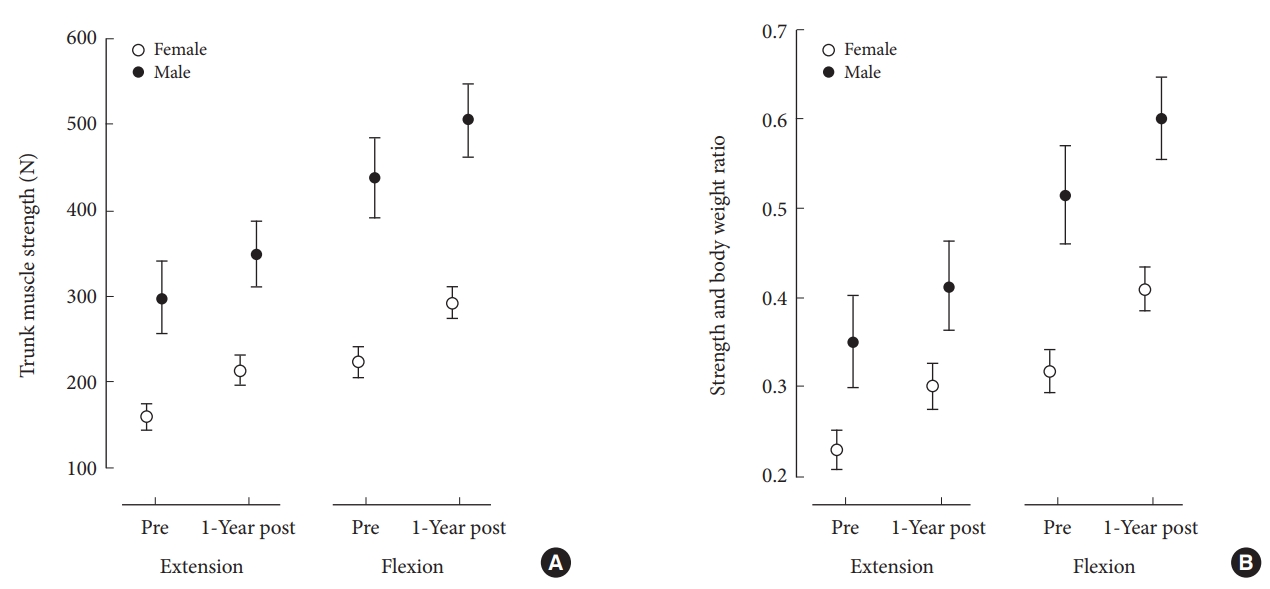
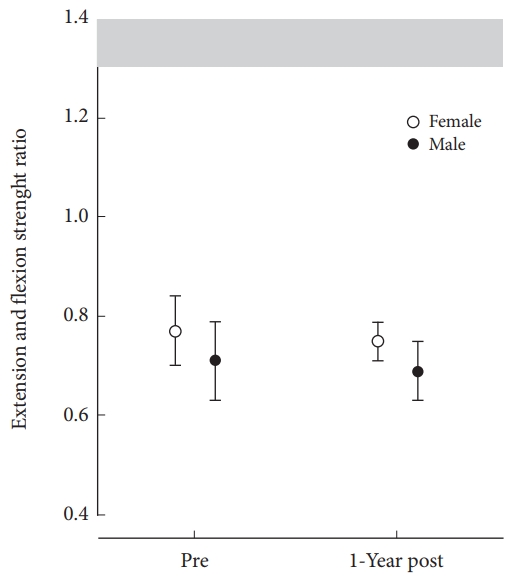
The preoperatively measured trunk muscle strength levels were considerably low (Table 2). The mean┬▒SD increase in trunk extension strength was 53┬▒118 N and in flexion 69┬▒116 N (both p<0.001) from before surgery to the 12-month postoperative follow-up. The mean increase per body weight was 0.07 (p<0.001) for extension and 0.09 for flexion (p<0.001). The strength levels of sex are presented in Fig. 2A and B. The pain intensity, during both trunk extension and flexion tests, decreased significantly and the E/F remained almost unchanged during the follow-up. Fig. 3 shows the E/F strength ratio in the men and women. In both univariate and multivariate regression analyses, male gender, lower age, milder preoperative back pain, and greater preoperative strength were significantly associated with better 12-month extension and flexion strength levels (Table 3). In addition, less back pain during the measurement was associated with a higher 12-month extension strength level.
DISCUSSION
Trunk muscle strength is required for all body movements and posture control, and therefore is an important part of overall daily physical functioning. In the present study, the maximal trunk muscle strength has increased during the 1-year postoperative follow-up. However, the strength gain was small and may not be clinically significant. The imbalance already found before surgery between the trunk extensors and flexors remained 12 months postoperatively.
In the present study, we found increases in the maximal trunk muscle strength levels at the 12-month postoperative follow-up. There are no previous 1-year follow-up studies without additional postoperative interventions and measuring trunk muscle strength as an outcome in LSF patients. The improvements in the strength of this study (26% in extension and 23% in flexion) were similar to those of the conservative treatment arm in a 1-year follow-up in the previous randomized controlled trial study by Keller et al. [11]. In that study, the isokinetic trunk extension strength increased by 27% after intensive rehabilitation. The rehabilitation protocol was a 3-week program, including supervised training, patient education, and discussions 25 hours/wk. In contrast, in their surgery group, the strength levels decreased by 19% during the 1-year postoperative follow-up [11]. However, despite the improvements observed in the present study, strength remained low: previously, in healthy subjects, the mean┬▒SD maximal trunk extension strength was reported to be 629┬▒233 N and the flexion strength was reported at 564┬▒235 N, measured with the same isometric device used in this study [13]. In the present study, the trunk muscle strength reached only half of the corresponding values of the healthy subjects. Mayer et al. [9] reported a maximal isometric flexion strength/body weight ratio of ~0.65 in men and ~0.45 in women (aged <45 years, healthy participants). The respective ratios for extension strength were ~1.15 in men and ~1.00 in women [9]. In the present study, the 1-year extension strength/body weight ratio was only one-third of the earlier reported values [9].
The low extensor strength observed in this study resulted in the imbalance in the trunk muscle strength, that is, the trunk flexors were stronger than the extensors before surgery and after the 12-month postoperative follow-up. Previously, in healthy subjects, the extensor muscles have been shown to be remarkably stronger than the flexors [9,13]. The isokinetic E/F strength ratio has been reported to be approximately 1.3 in healthy men and 1.4 in healthy women [9]. In contrast, in patients with chronic back pain and disc degeneration, the E/F strength ratio has been reported to remain imbalanced in follow-ups of 7 to 11 years [14]. In patients with chronic low back pain, the possible explanations for low extensor strength are muscle atrophy associated with disc degeneration and spondyloarthrosis, as well as pain inhibition [15]. Also avoiding the use of the back, that is, disuse, affects the spinal musculature [16]. Therefore, paraspinal muscle wasting has already begun before surgery due to long-standing pain [17]. Furthermore, during surgery, the retraction of the paraspinal muscles may lead to additional injury of the extensor muscles and maintain poor extension strength. In this study, the low back and leg pain intensities decreased significantly after LSF, which enabled better use of the spinal musculature and back. The patients received postoperative advice to self-administer physical activities in the early recovery phase. However, these physical activities and light trunk muscle exercises did not facilitate sufficient trunk muscle strength recovery.
The results of the present study also showed that milder preoperative low back pain and preoperative strength (in addition to male gender and lower age) were associated with better trunk flexion and extension strength levels at 12 months. Previous research found a wide spectrum of potential factors that contribute to muscle strength and function in patients with low back pain, such as changes in muscle structure [17], the patientsŌĆÖ motivation and pain tolerance [18], changes in fear-avoidance beliefs, in pain, or in self-efficacy [19].
The strengths of this study are the prospective setting and the representative sample of patients with LSF, including all principal types of spinal disorders leading to LSF over a wide age range (29ŌĆō85 years). In addition, we used physical measurements, which provide objective information about back function. The drop-out rate was considerably lower; of all of the recruited patients, 77% attended the 12-month follow-up. The limitation of the study is that the results cannot be generalized to the recovery of spinal surgery other than LSF.
In conclusion, trunk muscle strength improved during the 12-month follow-up after LSF. Despite the observed improvements, the strength levels remained low, and the imbalance between the extensors and the flexors persisted during the follow-up period. Sex and age as well as preoperative trunk muscle strength levels and the intensity of low back pain predicted the extension and flexion strength levels.