Postoperative Low-Dose Tranexamic Acid After Major Spine Surgery: A Matched Cohort Analysis
Article information

Abstract
Objective
This was a retrospective, cohort study investigating the efficacy and safety of continuous low-dose postoperative tranexamic acid (PTXA) on drain output and transfusion requirements following adult spinal deformity surgery.
Methods
One hundred forty-seven patients undergoing posterior instrumented thoracolumbar fusion of ≥ 3 vertebral levels at a single institution who received low-dose PTXA infusion (0.5–1 mg/kg/hr) for 24 hours were compared to 292 control patients who did not receive PTXA. The cohorts were propensity matched based on age, sex, American Society of Anesthesiologist physical status classification, body mass index, number of surgical levels, revision surgery, operative duration, and total intraoperative TXA dose (n = 106 in each group). Primary outcome was 72-hour postoperative drain output. Secondary outcomes were number of allogeneic blood transfusions.
Results
There was no significant difference in postoperative drain output in the PTXA group compared to control (660 ±420 mL vs. 710 ±490 mL, p = 0.46). The PTXA group received significantly more crystalloid (6,100 ±3,100 mL vs. 4,600 ±2,400 mL, p < 0.001) and red blood cell transfusions postoperatively (median [interquartile range]: 1 [0–2] units vs. 0 [0–1] units; incidence rate ratio [95% confidence interval], 1.6 [1.2–2.2]; p = 0.001). Rates of adverse events were comparable between groups.
Conclusion
Continuous low-dose PTXA infusion was not associated with reduced drain output after spinal deformity surgery. No difference in thromboembolic incidence was observed. A prospective dose escalation study is warranted to investigate the efficacy of higher dose PTXA.
INTRODUCTION
Major spine surgery for deformity correction is associated with risk for significant blood loss as well as cardiac, pulmonary, and renal complications [1-3]. Intraoperative blood loss is associated with coagulopathy and fibrinolysis that may contribute to ongoing blood loss in the postoperative period [4]. Use of intraoperative tranexamic acid (TXA), an antifibrinolytic, has demonstrated efficacy in reducing perioperative blood loss and transfusion requirements in doses range from 10–30 mg/kg bolus and 1–10 mg/kg/hour infusion [5-10]; however, the optimal dose and timing of TXA administration are unknown.
Patients undergoing major spine surgery for adult spinal deformity (ASD) have significant perioperative blood loss and increased rates of fibrinolysis which frequently occur during the later stages of the scoliosis procedures and, due to decortication, continue for several hours after the surgical procedure has ended [11-13]. Thus, continuing TXA into the postoperative period may be of benefit.
Although previous studies have demonstrated relative safety of intraoperative TXA [14], patients undergoing ASD surgery often present with significant comorbidity [15] and may be at increased risk for thromboembolic complications with prolonged infusion of TXA during the postoperative period. We proposed an investigational study of the efficacy and safety of an extended infusion of low-dose postoperative TXA (PTXA) in this patient population.
Here we present the results of a multistage dose escalation study to investigate the efficacy and safety of continuous PTXA infusion. We compared low-dose (0.5–1 mg/kg/hr) 24-hour continuous PTXA infusion in ASD patients undergoing major multilevel instrumented thoracolumbar spinal fusion to propensity-matched controls. We hypothesize that low-dose PTXA reduces drain output and transfusion requirements after major spine surgery for ASD without increasing the risk of major complications.
MATERIALS AND METHODS
This study was approved by the Institutional Review Board for Health Science Research (HSR-19790) and the requirement for written approved consent was waived.
1. Sample
The study group was comprised of ASD patients who underwent posterior instrumented thoracolumbar spinal fusion involving ≥ 3 levels, based on surgical Current Procedural Terminology code, at a single university medical center between July 2017 and February 2019 and who received a continuous TXA infusion (0.5–1 mg/kg/hr) for 24 hours postoperatively. PTXA patients were compared to control patients from the same time period who were managed without PTXA.
Intraoperative management was not standardized in this retrospective study. In general, anesthesia was induced with intravenous lidocaine (1–1.5 mg/kg), propofol (1–2 mg/kg), and rocuronium (0.5–1 mg/kg) which was administered as a single dose to facilitate tracheal intubation and was not redosed during cases involving neuromonitoring. Arterial and central venous access were obtained after induction of anesthesia if required. Anesthesia was maintained with intravenous infusions of propofol (50–150 μg/kg/min), lidocaine (40 μg/kg/min), ketamine (0.3–0.5 mg/kg/hr), with or without up to one half minimum alveolar concentration of volatile anesthetic to facilitate neuromonitoring. Intravenous methadone (0.1–0.2 mg/kg) was administered for analgesia. Phenylephrine and norepinephrine infusions were used to maintain systolic blood pressure > 90 mmHg and mean arterial pressure > 60 mmHg.
Intraoperative TXA was routinely used in all cases with anticipated blood loss greater than 1 L. Dosage ranged from 10–30 mg/kg bolus and 1–5 mg/kg/hr infusion based on the discretion of the surgeon and anesthesiologist. Autologous transfusion was used in cases where blood loss was anticipated to be greater than 1 liter and salvaged blood was returned to the patient. Packed red blood cells (PRBC) were administered for arterial blood gas hemoglobin concentration (HGB) < 9.0 g/dL. A ROTEM (rotational thromboelastometry) treatment algorithm utilizing EXTEM (external temogram) and FIBTEM (fibrinogen temogram) assays was used to guide fresh frozen plasma (FFP), cryoprecipitate, and platelet transfusion as previously described [4].
Patients were monitored postoperatively in the postanesthesia care unit or intensive care unit. PTXA infusion was continued at 0.5–1 mg/kg/hr for 24 hours postoperatively for all patients where intraoperative blood loss was estimated to be greater than 1 L. Postoperative drain output was recorded every 8 hours. Postoperative blood product transfusion thresholds were HGB < 8.0 g/dL, international normalized ratio > 1.5 or partial thromboplastin time (PTT) > 35 seconds, fibrinogen < 150 mg/dL, and platelet count < 80,000 per μL.
2. Outcome
The primary outcome was 72-hour subfascial drain output. Secondary outcomes included postoperative allogenic blood transfusions including PRBCs, platelet, FFP, and cryoprecipitate. Adverse events including deep vein thrombosis (DVT), pulmonary embolus (PE), myocardial infarction (MI) (troponin I level > 0.02 ng/mL and presence of electrocardiographic changes from baseline), cerebral vascular accident (CVA), seizure, acute kidney injury (AKI) (serum creatinine > 0.3 mg/dL increase from baseline) and surgical site infection (SSI) were analyzed.
3. Covariates
Preoperative variables included demographic data (age, gender, body mass index [BMI], and American Society of Anesthesiologists [ASA] physical status classification), vital signs, coagulation parameters (hemoglobin, platelet count, prothrombin time, PTT, fibrinogen level), and medical comorbidities including smoking history, chronic obstructive pulmonary disease, asthma, prior MI, congestive heart failure, hypertension, PE, and pneumonia.
Intraoperative variables included number of operative vertebral levels (classified as 3–6 levels, 7–12 levels, or greater than 13 levels based on surgical current procedural technology [CPT] code), revision surgery status (or prior spinal fusion), operative time, TXA bolus and infusion dose, estimated blood loss (EBL), volume of crystalloids and colloids, number of PRBC, FFP, platelet and cryoprecipitate and autologous transfusions, intraoperative arterial blood gases, and coagulation data.
Postoperative variables including PTXA bolus and infusion dose, subfascial drain output through 72 hours postoperatively, volume of crystalloids and colloids, number of PRBC, FFP, platelet and cryoprecipitate transfusions, postoperative arterial blood gases, blood and coagulation parameters, length of hospital stay, and incidence of adverse events as defined above.
4. Statistical Analysis
All statistical analyses were performed using Stata 15.1 (StataCorp LP., College Station, TX, USA). Baseline and intraoperative variables were compared between the PTXA and no PTXA cohorts. Continuous and categorical variables were compared using Student t-test or Mann-Whitney U-test and Pearson χ2 or Fisher exact tests, respectively, where appropriate. Among the baseline and intraoperative variables, age, sex, ASA physical status classification, BMI, surgical levels, revision surgery, surgery duration, and total intraoperative TXA dose were matched between the 2 cohorts, without replacement, in a 1:1 ratio with a caliper of 0.20 using propensity scores derived from comparisons of these variables. The matching process was performed using the PSMATCH2 package developed for Stata [16]. Balance of baseline characteristics was assessed using standardized differences, and differences of < 0.20 between the baseline characteristics of the matched cohorts were considered adequate balance. Univariate linear, Poisson, and logistic regression analyses of primary and secondary outcomes were performed for the unmatched and matched cohorts. Fisher exact test was used to assess relationships between the use of postoperative TXA use and outcomes with zero frequencies. Statistical significance was defined as p < 0.05, and all tests were 2-tailed. Missing data were not imputed.
5. Power Analysis
Results of a power analysis assuming a mean postoperative drain output of 1,500±500 mL in the control group and alpha of 0.05 showed that a sample size of 44 subjects per group (88 total) would provide 80% power to detect a 20% decrease in postoperative drain output in the PTXA group.
This manuscript adheres to the STROBE (Strengthening the Reporting of Observational Studies in Epidemiology) guidelines.
RESULTS
One hundred forty-seven PTXA patients were matched 1:1 to 292 control who did not receive PTXA. Preoperative demographic variables, vital signs, blood coagulation parameters, and medical comorbidities in the unmatched groups are shown in Table 1. Primary and secondary outcomes variables are shown in Table 2.

Comparison of baseline characteristics between unmatched patients with and without postoperative TXA infusion

Comparison of outcomes between unmatched patients with and without postoperative TXA infusion
Subjects were matched by age, sex, ASA physical status classification, BMI, number of surgical levels, revision surgery, operative duration, and total intraoperative TXA dose (106 subjects in each group). Propensity score-matched variables before and after matching and reduction in standardized bias is shown in Supplementary Table 1 and standardized percent bias across covariates shown in Supplementary Fig. 1. After propensity matching, the PTXA group had significantly greater EBL (2,100±1,000 mL vs. 1,300±900 mL, p < 0.001) and received significantly more colloid (1,700±700 mL vs. 1,300±800 mL, p < 0.001), PRBCs (2 [0–3] units vs. 0 [0–2] units, p < 0.001), cryoprecipiate (0 [0–1] unit vs. 0 [0–0] units, p = 0.002), and autologous transfusion (740±440 mL vs. 330±410 mL, p < 0.001) (Table 3) intraoperatively.
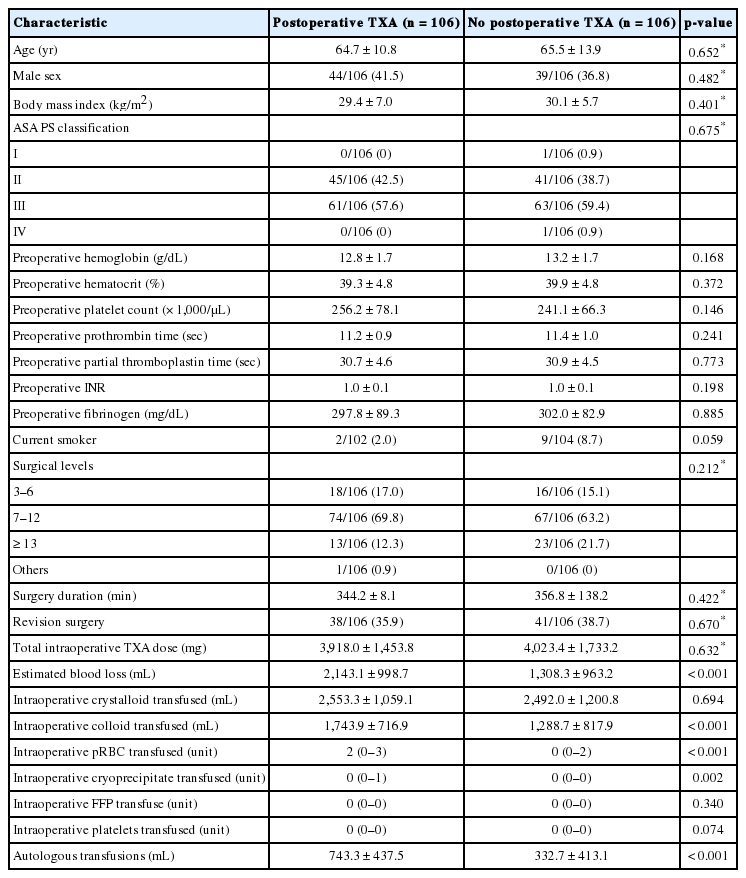
Comparison of baseline characteristics between matched patients with and without postoperative TXA infusion
Primary and secondary outcomes in the propensity-matched cohorts are shown in Table 4. Postoperative drain output was not statistically significantly different between the PTXA group compared to control (660±420 mL vs. 710±490 mL, p = 0.46). The PTXA group received significantly more crystalloid (6,200±3,100 mL vs. 4,600±2,400 mL, p < 0.001) and red blood cell transfusions (median [interquartile range]: 1 [0–2] units vs. 0 [0–1] units; incidence rate ratio [95% confidence interval], 1.6 [1.2–2.2]; p = 0.001) in the first 72 hours after surgery. Rates of adverse events did not differ between groups.

Comparison of outcomes between matched patients with and without postoperative TXA infusion
DISCUSSION
We report the results of a multistage dose escalation study in which we demonstrate the safety and efficacy of continuous low-dose TXA (0.5–1 mg/kg/hr) for major spine surgery for ASD. The PTXA and matched control propensity-matched groups underwent procedures of similar complexity; however, intraoperative blood loss and immediate perioperative resuscitation requirements, including colloid, number of PRBC and cryoprecipitate transfusions, and autologous transfusions were greater in the PTXA compared to the control group. Appropriate management of coagulopathy by transfusion of cryoprecipitate in the PTXA group may have reduced postoperative drain output, despite the higher intraoperative blood loss in the PTXA group. There was no significant difference in postoperative drain output during the first 72 hours after surgery. The PTXA required significantly greater volume crystalloid and PRBC transfusions postoperatively compared to the control cohort which is likely a reflection of ongoing perioperative resuscitation.
Several recent meta-analyses have shown that intraoperative TXA reduces intraoperative and postoperative blood loss and transfusion requirements. Cheriyan et al. [5] reviewed 11 trials of 644 patients who received intravenous TXA and found that TXA reduced intraoperative, postoperative and total blood loss by 219 mL, 119 mL, and 202 mL, respectively. There was a 33% reduction in the perioperative transfusion in the TXA group compared to control. The incidence of adverse events was low; there was one MI in the TXA group and one DVT in the control group. Li et al. [7] compared the efficacy of TXA to aprotinin and epsiolon-aminocaproic acid (EACA) in a meta-analysis of 13 trials of 943 spine surgery patients. All antifibrinolytics reduced perioperative blood loss and transfusion. However, TXA was more effective than aprotinin or EACA with a 53% reduction in intraoperative blood loss, 20% reduction in postoperative blood loss, and 62% reduction in blood transfusion observed in the TXA group [7]. It is interesting, therefore, that our data demonstrate higher intraoperative blood loss for the PTXA group than the control group. This may in turn suggest a potential benefit of PTXA in the early postoperative period if EBL was greater in the PTXA group but drain output was not significantly different than control.
A significant finding in our study is that we did not observe a difference in adverse events, including DVT, PE, MI, CVA, seizure, AKI, or SSI in patients who received PTXA compared to controls. Previous studies have reported the safety of TXA, suggesting that adverse events such as MI and thromboembolism are rare and the incidence no different than control subjects [5,8,9]. The incidence of thromboembolic events observed here was low (3 DVT [2.8%] in the PTXA group compared to 1 [0.9%] in the control group and 1 PEs [0.9%] in the PTXA group compared to 4 [3.8%] in the control group]. It is important to note that this study was not adequately powered to determine the incidence of adverse events. Lin et al. [17] reported the safety of high-dose TXA (50 mg/kg bolus and 5 mg/kg/hr infusion) in 100 consecutive ASD patients and found 3 thromboembolic complications including 1 PE and 2 DVTs in patients. There was 1 MI in each group, 2 cases of AKI, and no reported seizures, or strokes reported.
A limitation of this study was the difference in estimated intraoperative blood loss between PTXA and control groups despite propensity matching based on surgical procedure. Surgical CPT code does not thoroughly capture all aspects surgical complexity such as number and type of osteotomy (Smith-Peterson vs. pedicle subtraction) which are associated with differing amounts of blood loss and may contribute to differences in EBL. Other factors, such as surgeon, changes in operative technique and the transition to rotational thromboelastometry-guided blood product management [4] during the study time frame, may also have contributed to differences in EBL between the PTXA group and historical controls. Intravascular volume status was estimated by hemodynamics, arterial blood gas measurements, volume of salvaged blood, and EBL. Measures such as central venous pressure or urine output were not used for propensity matching as these were not routinely available.
Our results suggest that low-dose TXA (0.5–1 mg/kg/hr) is not effective in reducing drain output and allogenic transfusion requirements in the postoperative period; however, it important to note that we chose a low infusion dose to minimize risk of seizures and thromboembolic events in our ASD patients undergoing highly invasive procedures who may be at increased risk for these complications. Higher doses of postoperative TXA may potentially reduce postoperative drain output and transfusion requirements and future prospective dose escalation studies to investigate the safety and efficacy of higher dose continuous PTXA are planned.
CONCLUSION
Low-dose PTXA infusion was not associated with significantly reduced drain output after ASD surgery. However, despite having greater intraoperative blood loss and blood transfusions, PTXA infusion was associated with similar postoperative drain output compared to control, with no difference in thromboembolic incidence. A prospective dose escalation study controlling for intraoperative factors is required to establish the safety and efficacy of higher dose PTXA.
Notes
The authors have nothing to disclose.
Acknowledgements
The authors would like to thank Amir Abdel Malek for assistance with data collection.
SUPPLEMENTARY MATERIALS
Supplementary Table 1 and Fig. 1 can be found via https://doi.org/ns.2040114.057.
Propensity score matched variables before and after matching and reduction in standardized (std.) bias
Standard percent bias across covariates. TXA, tranexamic acid; ASA PS, American Society of Anesthesiologists physical status; BMI, body mass index.