Relationship Between Endplate Defects, Modic Change, Facet Joint Degeneration, and Disc Degeneration of Cervical Spine
Article information

Abstract
Objective
The “disc degeneration precedes facet joint osteoarthritis” hypothesis and multidimensional analysis were actively discussed in lumbar spine. However, in cervical spine degeneration, the multifactorial analyzes of disc degeneration (DD), Modic changes (Mcs), facet degeneration, and endplate degeneration (ED) is still limited. In this cross-sectional study, we aimed to analyze the prevalence and interrelationship of cervical DD parameters.
Methods
We retrospectively recruited 62 patients aged between 60 and 70 years. The disc height, segmental angle, ossified posterior longitudinal ligament (OPLL), ED, facet joint degeneration (FD), uncovertebral joint degeneration (UD), DD, spinal stenosis (SS), Mc, and cord signal change (CS) were evaluated using a previously well-known grading system.
Results
The prevalence of cervical degenerative parameters were DD (grade 1, 1.2%; grade 2, 13.3%; grade 3, 54.8%; grade 4, 19.0%; grade 5, 11.7%), OPLL (26.2%), SS (grade 0, 7.7%; grade 1, 42.3%; grade 2, 26.2%; grade 3, 23.8%), UD (39.1%), ED (normal, 69.0%; focal defect, 9.7%; corner defect, 11.7%; erosion, 6.9%; sclerosis, 2.8%), and FD (normal, 48.8%; narrowing, 27.0%; hypertrophied, 24.2%). The interrelationship of degenerative parameters showed close relation between UD, SS, DD, OPLL, Mc. ED, and CS has partial relation with degenerative finding. FD only has relation with UD, and Mc.
Conclusion
Our results may indicate that FD is a degeneration that occurs independently, rather than as a result of other degenerative factors.
INTRODUCTION
Neck pain is a multidimensional phenomenon that affects as much as two-thirds or more of the general population [1]. Among the many causes of neck pain, degeneration of the cervical disc is a common condition [2]. However, the veritable cause of the cervical disc degeneration (DD) remains unclear. In analogy to this, the main opinion on the initial process of spinal degeneration is that degeneration begins in the intervertebral disc and facet joint degeneration (FD) occurs following DD [3-5]. However, other authors point out that DD does not necessarily antecedent of facet degeneration [6-8]. In addition, in the study of lumbar intervertebral DD, a hypothesis about endplate degeneration (ED) driven DD was also presented [9-11], Furthermore, the multifactorial analyzes of DD, Modic changes (Mcs), facet degeneration, ED, and pain are also recently evaluated [12,13]. However, this approach is still limited in cervical spine degeneration studies. In particular, the cervical spine differs from the lumbar spine, such as uncovertebral joint, ossified posterior longitudinal ligament (OPLL), and a higher range of motion (ROM). In this regard, multifactor analysis thereof is necessary for the cervical spine.
In this cross-sectional study, we aimed to analyze the prevalence and interrelationship of segmental ROM, facet degeneration, endplate defect, OPLL, uncovertebral joint degeneration (UD), Mc, and cervical DD.
MATERIALS AND METHODS
1. Patient Population
We retrospectively recruited patients aged 60 and 70 years, who underwent all C-spine X-ray series (upright lateral images on neutral, flexion, and extension position), conventional magnetic resonance imaging (MRI), and computed tomography (CT) at our hospital, between January 2018 to December 2018. All patients with a history of fracture, tumor, infectious spondylitis, deformity, or previous cervical operation were excluded. Finally, 62 patients were included. (average age, 63.60±2.94; 39 males [62.9%] and 23 females [37.1%]) A total 62 patients, 310 segments (from C3/4 to C7/T1) were evaluated, but C7/T1 has an invisibility endplate margin (16/62 segments, 25.8%), so, we only excluded this level, final enrolled segments were 244, from C3/4 to C6/7.
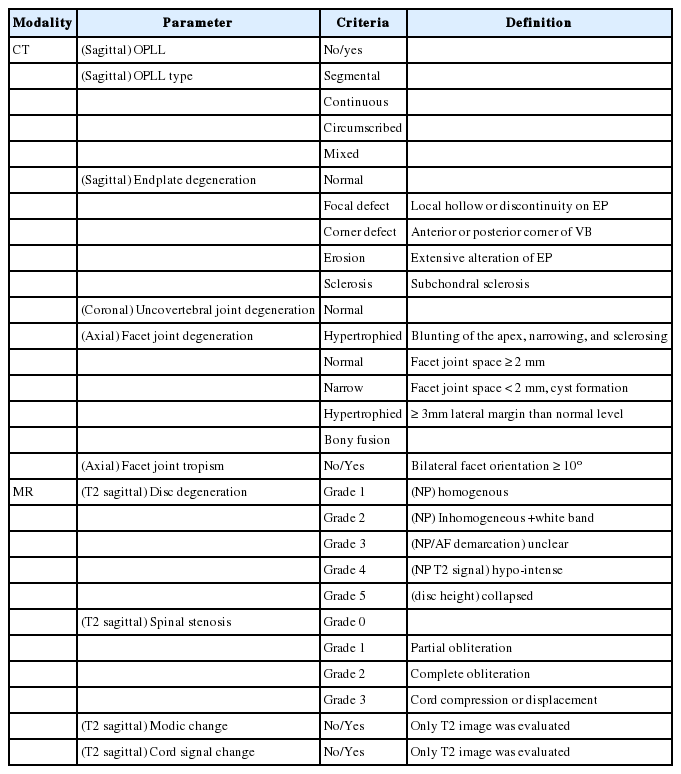
2. Radiologic Measurements (Table 1)
Measuring method for radiological parameters
All from C3/4 to C7/T1 level were measured following degeneration-related parameters.
1) C-spine X-ray series
The segmental angle (SA) of each level from C3–4 to C7–T1 at neutral, flexion, and extension position, and disc height of the mid vertebral body at the neutral position were measured. Segmental ROM (SA ROM) was the difference of SA between flexion and extension (Fig. 1)

Measurement methods for X-ray parameters: (A) segmental angle at flexion position, (B) disc height and segmental angle at neutral position, and (C) segmental angle at extension position. SA, segmental angle.
2) CT of C-spine
Using sagittal images, we measured OPLL (present or not) and OPLL type (segmental, continuous, circumscribed, and mixed) [12,14-17], and ED (normal, focal defect, corner defect, erosion, and sclerosis) [18]. Using coronal images, UD was evaluated (normal, hypertrophied). On axial images, FD (normal, narrowing, and hypertrophied) [19,20], and facet tropism (bilateral orientation difference > 10°) [21] were measured.
3) MRI of C-spine
Using sagittal T2-weight sequences, we measured DD grade (using Pfirrmann grade—grade 1: disc is homogeneous with bright hyper-intense white signal intensity [SI] and normal disc height, nucleus and annulus are clearly differentiated, and disc height is normal; grade 2: disc is inhomogeneous, but keeping the hyper-intense white signal, and a grey horizontal band could be present; grade 3: disc is inhomogeneous with an intermittent grey SI, distinction between nucleus and annulus is unclear, disc height is normal or slightly decreased; grade 4: disc is inhomogeneous with a hypo-intense dark grey SI, there is no more distinction between the nucleus and annulus, disc height is slightly or moderately decreased; grade 5: disc is inhomogeneous with a hypo-intense black SI, and the disc space is collapsed) [22], spinal stenosis grade (SS; using Muhle grade—grade 0: normal, grade 1: partial obliteration of the anterior or posterior subarachnoid space or of both, grade 2: complete obliteration, grade 3: complete obliteration with cervical cord compression of displacement) [23], Mc (only T2 sequence was measured), and cervical spinal cord signal change (CS: only T2 sequence was measured).
3. Statistical Analysis
All statistical analyses were evaluated using IBM SPSS Statistics ver. 21.0 (IBM Co., Armonk, NY, USA). Some ordinary parameters were reclassified into binary categories according to degeneration or not; SS: grade 0+1 (control) vs. grade 2+3 (degeneration), ED: normal vs focal defect, corner defect, erosion, sclerosis (degeneration), FD: grade 1 (control) vs. grade 2+3 (degeneration), DD: grade 1+2 (relative lower degeneration group) vs. grade 4+5 (relativ e high degeneration group). In Table 2, generalized estimating equation was performed to reduce within-person bias that measured the binary degenerative variable incidence (degeneration or not) for multiple levels (from C3/4 to C6/7). In Tables 3 to 5, it was assumed that the degeneration degree of each level was patient-independent and level-independent, and chi-square or Fisher exact test was used. For continuous variables, presented as mean±standard deviation, and the independent t-test or 1-way analysis of variance (ANOVA) was adopted to assess the difference of each degenerative parameters, or levels. For categorical or ordinal variables, the Spearman correlation analysis was performed to detect the interrelationship between degenerative parameters.

Degenerative change according to level

Interrelationship between polynomial degenerative parameters

Disc height, segmental angle (SA), segmental range of motion (ROM), and degenerative parameters
4. Ethics Statement
The study protocol was approved by the Institution Review Board (IRB) of the affiliated hospital, which waived the requirement for informed consent due to the retrospective nature of this study (IRB No. I-2020-249).
RESULTS
1. Prevalence of Degenerative Change
1) CT findings
OPLL (26.2%), OPLL type (normal, 74.6%; segmental, 20.2%; continuous, 0%; circumscribed, 1.6%; mixed, 3.6%), ED (normal, 69.0%; focal defect, 9.7%; corner defect, 11.7%; erosion; 6.9% and sclerosis 2.8%), UD (39.1%), FD (normal, 48.8%; narrowing 27.0%; hypertrophied, 24.2%). Only 8 segments (3.2%) had a facet tropism.
2) MR findings
DD (grade 1, 1.2%; grade 2, 13.3%; grade 3, 54.8%; grade 4, 19.0%; grade 5, 11.7%), SS (grade 0, 7.7%; grade 1, 42.3%; grade 2, 26.2%; grade 3, 23.8%), Mc (23.8%), and CS (14.9%).
2. Degenerative Change According to Level
The prevalence of cervical degenerative parameter was summarized in Table 2. There was a difference in the prevalence of degenerative parameter according to level, except FD, Mc, and CS.
3. Interrelationship Between Degenerative Parameters
1) The Spearman correlation test
For the multiple or ordinary parameters (ED, DD, SS, and FD), the interrelationship between degenerative change was summarized in Table 3. DD had interrelationship with all degenerative parameter but FD. SS had interrelationship with all degenerative parameter but ED. ED related with UD, DD, OPLL, but had no relation with SS, CS, and FD. FD only had a relation with UD and Mc.
2) Interrelationship between degenerative parameters (binary analysis)
The interrelationship between binary degenerative parameter was summarized in Table 4. UD related to all degenerative parameters. Other parameters showed partial interrelationship with each other. However, FD had only 2 related factors: Mc and UD. Compared with the result of K independent samples test, DD had relatively low interrelationship compared with other parameters because of lower enrolled segments (grade 3 degeneration: 136/248 segments, 54.8% was excluded in binary analysis).

Interrelationship between binary degenerative parameters
4. Disc Height, SA, Segmental ROM, and Degenerative Parameters
Male patients had a higher disc height, and SA than female (p = 0.001 and p = 0.048, respectively). There was a difference in disc height, SA, or SA ROM according to degenerative parameters except for CS and FD (Fig. 2, Table 5).
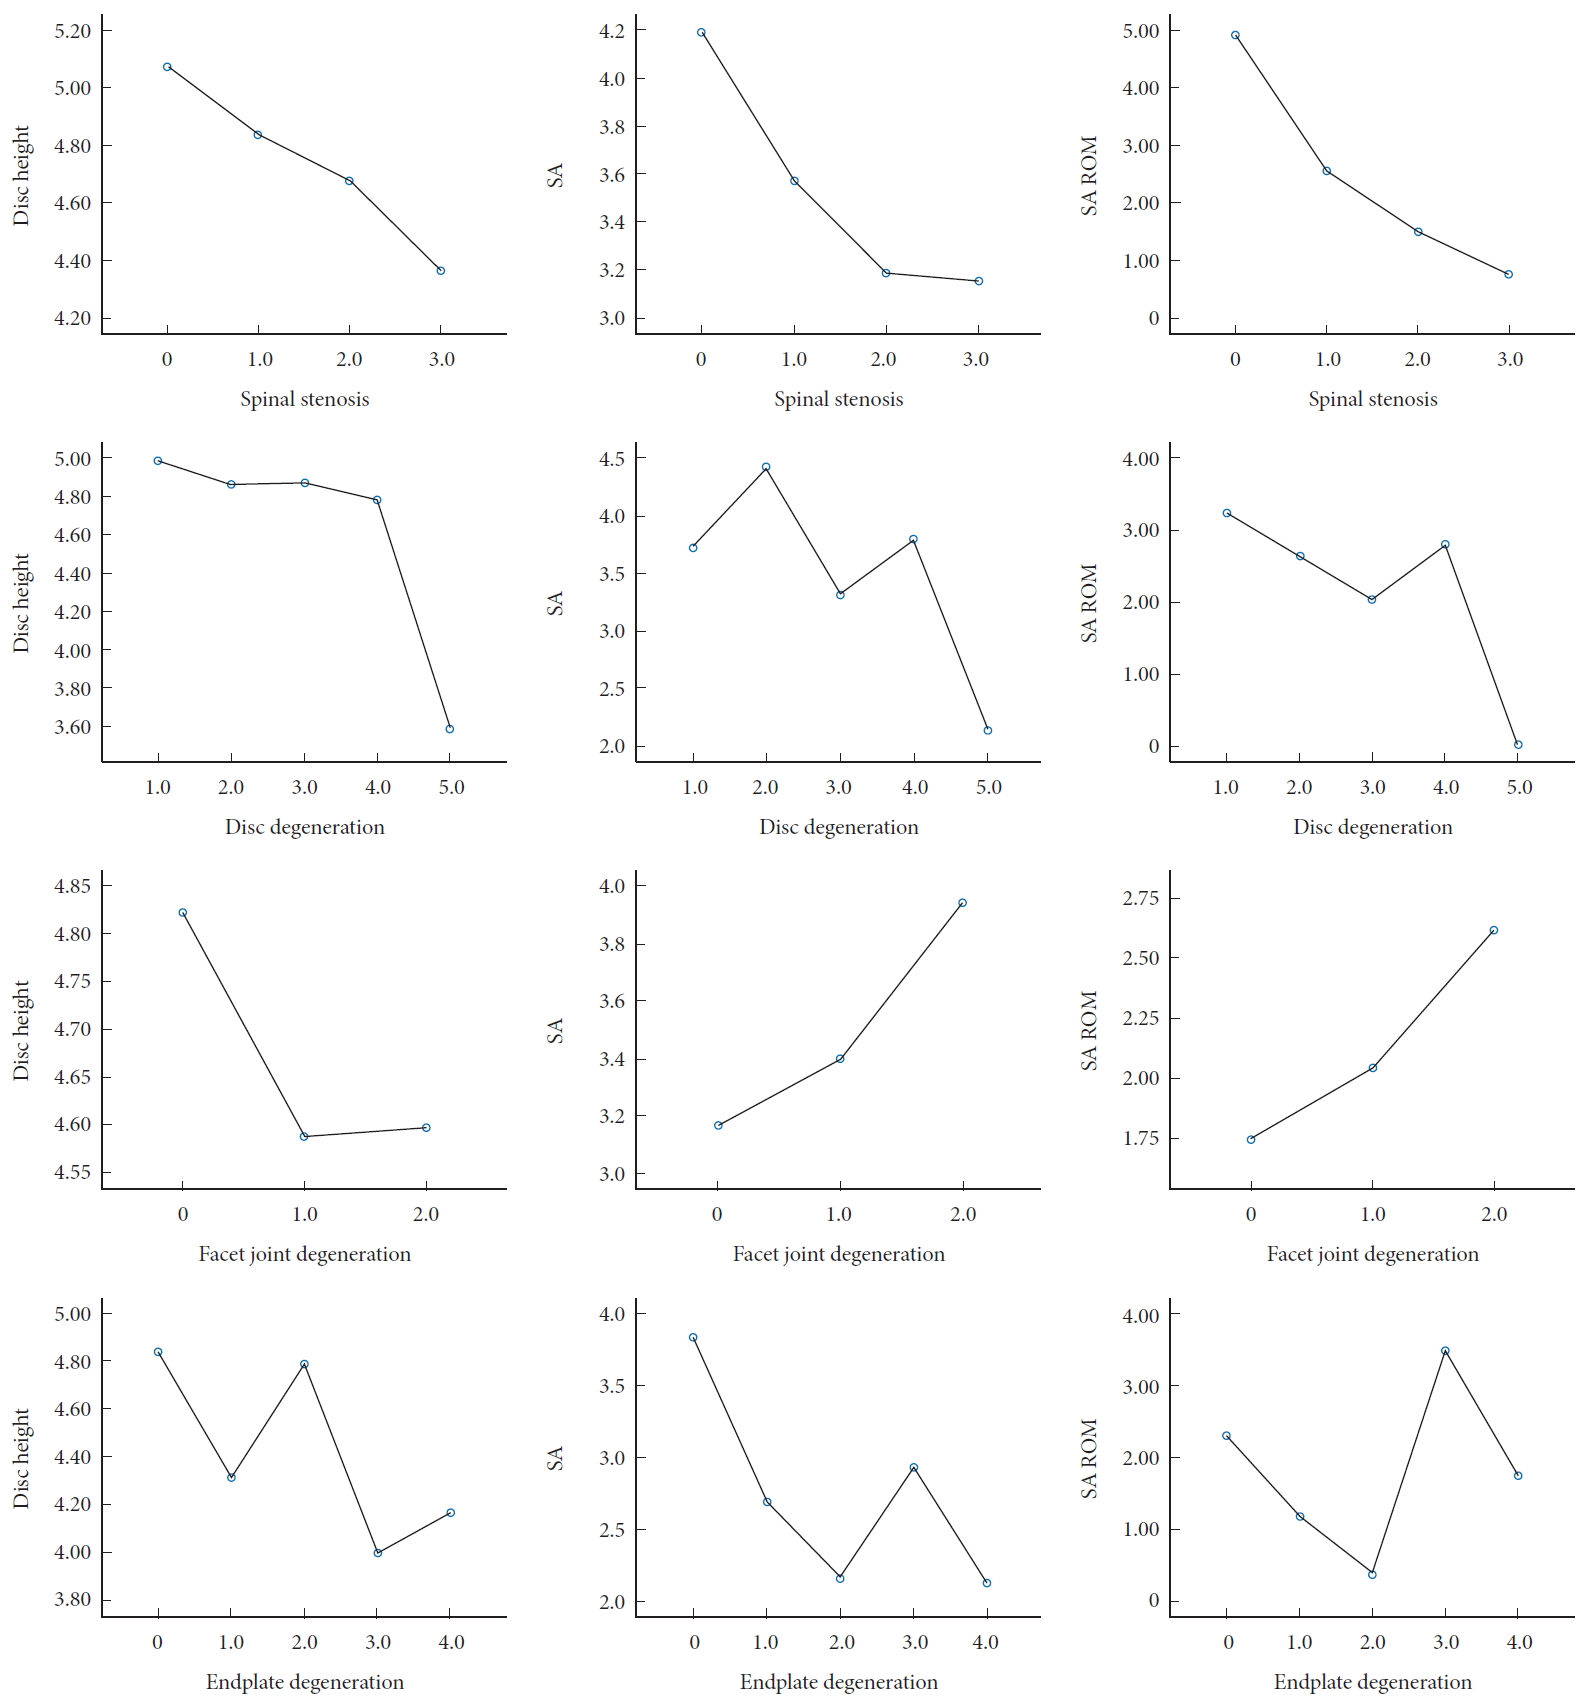
Analysis of variance study for disc height, segmental angle (SA), SA range of motion (SA ROM), and spinal stenosis, disc degeneration, facet joint degeneration, and endplate degeneration grade.
DISCUSSION
Degenerative changes at the lower cervical spine can affect different anatomical structures: the intervertebral disc, uncovertebral joints, and facet joints [24]. Cervical radiculopathy is frequently secondary to osteoarthritic changes of the uncovertebral joints anteriorly or facet joints posteriorly rather than DD [25]. In this analogy to this, to understand the interrelationship between cervical degenerative parameters is important. There was some study about the relationship between age [26], FD [20], facet orientation/tropism [21], Mc [12,27,28], and DD, but there was no study including ED, OPLL, UD, and SS.
The cervical FD was classified by several authors. Rydman et al. [16] study found that the facet narrowing has relatively high reliability than osteophyte and articular surface irregularities (kappa value, 0.569, 0.313, 0.365, respectively). In that sense, we adopted the method used by Park et al. for the FD grade [20]. Grade 4, a bony fusion of the facet joint, was not identified in our study. Kettler et al. [26] classified the degree of FD through cadaveric studies. They also report that FD increases with age and evenly distributed at all levels. Kim et al. [29] evaluated the prevalence of asymptomatic cervical FD using CT imaging. They reported 33% of prevalence, and C6/7 were the most affected level. They also agreed on the age-related prevalence of cervical FD. As in the previous 2 studies, age has high relevance in FD.
To exclude the effects of age, and to focus on interpreting the interrelationship between cervical degenerative parameters, we only included patients with age from 60 to 70. Walraevens also pointed out the lack of evidence about the relationship between the DD and facet degeneration in the cervical spine, which has been thoroughly investigated in lumbar spine degeneration [30-33]. They reported a spatial weak correlation between FD and DD [34]. In the current study, FD had a relationship with UD and Mc. But FD was not related with other factors. In that sense, FD occurs relatively independently of other cervical degeneration parameters. The prevalence of degenerative factors according to level is also in line with these findings. The prevalence of cervical spine degeneration was different according to the cervical level. In particular, the prevalence of OPLL, ED, UD, grade 4 DD, and grade 2–3 SS was higher in C5–6. However, FD, Mc, and CS did not show a statistically significant difference by level. These results also could be evidence that these exceptions factors have a different mechanism from others. We can also found that these results are on the opposite side of the “disc degeneration precedes facet joint osteoarthritis” hypothesis [30,35] in the cervical spine.
Recently, there were 2 studies of multifactorial analysis for lumbar spine degeneration including ED. Lv et al. [12] demonstrated that ED would accelerate the change of facet joint orientation and facet tropism in segments with MCs. Zehra et al. [13] found the prevalence of ED (67.5% of the subjects and in 13.5% of the endplates). ED has a significant relationship with disc degenerative scores, Mcs, and posterior disc displacement (p < 0.05). The cumulative endplate defect scores, which they devised, increased with narrow facet joints (p = 0.004). They also showed clinical correlation according to the size of endplate defect. Sahoo et al. [18] also found the association between ED and symptomatic lumbar disc herniation, and the presence of ED can increase the neurological deficit, and reduce the chance of recovery with conservative management. These studies emphasized the importance of ED and endplate morphology [10]. The classification of ED of the lumbar spine was defined several authors [12,15,18], but there was no method to measure ED of the cervical spine. We revised the ED classification for the lumbar spine to the cervical spine. However, the small size of cervical vertebrae, we cannot obtain a clear view of the endplate in magnetic resonance (MR) images. We found that Sahoo et al. [18] showed that the CT image could demonstrate endplate defects similar to MR. Because we could obtain more clear view for ED in CT images, we adopted ED classification using CT images.
We tried to suggest whether our analysis is meaningful not only for categorized variables (UD, FD, etc.) but also for radiological continuity variables. In that sense, the radiological factors related to segment, disc height, SA, and segment motion were measured. In particular, disc height reduction, segmental kyphosis, and loss of segmental motion are related with degeneration. OPLL, UD, Mc, and Cs are binary variables and can present all the information by Table 5, but ordinary variables such as ED, FD, DD, and SS cannot present all the information. So, we visualized it as Fig. 2. It demonstrates the change of disc height, SA, and segmental motion according to the degeneration grade. As the degeneration grade of SS, DD, ED progresses, the disc height, SA, and SA ROM decrease, but the FD shows a different pattern. These results also support that FD has a different mechanism from other degenerative factors such as SS, DD, and ED. In the case of ED, some statistical significance was obtained in ANOVA, but there was a low agreement in linear to linear combination than other factors (Fig. 2). In the grade 3, endplate erosion, SA and SA ROM tended to be relatively high than other degenerative grades, and in the grade 2, corner defects, disc height was relatively high than other degenerative grades. We suggested that these results are due to the accuracy limitations of ED classification. Previous studies have reported poor agreement of endplate sclerosis of the cervical spine using CT images (kappa value= 0.241, p = 0.092) [16]. In our study, endplate sclerosis was founded in 1 of 3 disc grade 1 segments. This shows that there is a limitation in measuring the endplate erosion using CT images. In a future study, it is necessary to re-evaluate grade 3 through a reliability test.
Some limitation of the present study should be acknowledged. First, our enrolled patients had a radiological selective bias. Only a few patients take both CT and MRI, and they are also more likely to have ventral lesions that require surgical treatment. In that sense, the statistical interpretations were radiologically dominated with; grade 3 DD with a higher prevalence of CS up to 14.9%, as well as a predilection to contain OPLL up to 26.2%.in current study group. The patients enrolled in our retrospective study cannot reflect the interrelationship between degenerative parameters of healthy volunteer or patients with mild degeneration. Second, the binary analysis was performed except grade 3 DD. We want to present the strength of the relationship (odds ratio) between degenerative parameters using binary analysis (degeneration or not). OPLL, UD, Mc, CS are originally binary variables, and FD and ED can be classified as normal or degeneration. The classification for SS also has significant differences between grades 0, 1 and grades 2, 3, so there are no problems with conversion to binary variables. However, our enrolled patients have the most prevalence of grade 3 DD (not too advanced, 54.8%). There were limitations in the binary analysis including grade 3 DD to either group (grade 1+2+3 vs. 4+5 or grade 1+2 vs. 3+4+5). We used nondegenerated group (grade 1+2) and degeneration group (grade 4+5) except grade 3 DD for more clarity binary analysis. Third, we did not validate the ED classification using CT images. In addition, our study data reported by one reader and does not include intraclass correlation (ICC) results. In this study, our goal is not to verify the accuracy or validity of the measurement method. In the future study, the ICC test and reliability test will be required for more accurate measurement. Fourth, 2 cross-sectional studies negated the association between neck pain and radiological studies [36,37]. In this study, we did not evaluate the correlation with clinical information. Since we had to present too much factors information, there was a limit to analyzing the clinical information together. Future research will further analyze the relevance to clinical information on the basis of the result of the current study.
CONCLUSION
We confirmed a close correlation between DD, ED, SS, Mc, OPLL, and UD. However, FD was only related to Mc and UD, not to other factors. These results indicate that FD is a degeneration that occurs independently, rather than as a result of other degenerative factors, and negates the “disc degeneration precedes facet joint osteoarthritis” hypothesis in the cervical spine.
Notes
The authors have nothing to disclose.
Acknowledgements
This study was supported by a 2020 research grant from Pusan National University Yangsan Hospital.