Prediction of Discharge Status and Readmissions after Resection of Intradural Spinal Tumors
Article information

Abstract
Objective
Intradural spinal tumors are uncommon and while associations between clinical characteristics and surgical outcomes have been explored, there remains a paucity of literature unifying diverse predictors into an integrated risk model. To predict postresection outcomes for patients with spinal tumors.
Methods
IBM MarketScan Claims Database was queried for adult patients receiving surgery for intradural tumors between 2007 and 2016. Primary outcomes-of-interest were nonhome discharge and 90-day postdischarge readmissions. Secondary outcomes included hospitalization duration and postoperative complications. Risk modeling was developed using a regularized logistic regression framework (LASSO, least absolute shrinkage and selection operator) and validated in a withheld subset.
Results
A total of 5,060 adult patients were included. Most surgeries utilized a posterior approach (n=5,023, 99.3%) and tumors were most commonly found in the thoracic region (n=1,941, 38.4%), followed by the lumbar (n=1,781, 35.2%) and cervical (n=1,294, 25.6%) regions. Compared to models using only tumor-specific or patient-specific features, our integrated models demonstrated better discrimination (area under the curve [AUC] [nonhome discharge] = 0.786; AUC [90-day readmissions] = 0.693) and accuracy (Brier score [nonhome discharge] = 0.155; Brier score [90-day readmissions] = 0.093). Compared to those predicted to be lowest risk, patients predicted to be highest-risk for nonhome discharge required continued care 16.3 times more frequently (64.5% vs. 3.9%). Similarly, patients predicted to be at highest risk for postdischarge readmissions were readmitted 7.3 times as often as those predicted to be at lowest risk (32.6% vs. 4.4%).
Conclusion
Using a diverse set of clinical characteristics spanning tumor-, patient-, and hospitalization-derived data, we developed and validated risk models integrating diverse clinical data for predicting nonhome discharge and postdischarge readmissions.
INTRODUCTION
Intradural spinal tumors constitute up to 8% of all central nervous system tumors [1], and encompass both extramedullary tumors, such as schwannomas, and intramedullary tumors, such as ependymoma, astrocytoma, or hemangioblastoma [2]. Surgeries to resect these tumors are relatively complex procedures with wide variation in surgical practice and outcomes reported in the literature [3,4]. Large nationwide studies have reported complication rates as high as 18% and range broadly from wound hematoma and hemorrhage to urinary and pulmonary complications [5].
Prior studies have attempted to evaluate predictors of outcome after intradural tumor resection, but most have been single institution series, with relatively few numbers of patients studied and with limited interpretability across diverse healthcare systems and geographical regions [6-8]. Using a nationwide longitudinal database containing the healthcare claims of over 150 million enrollees covered by qualifying insurance plans, we sought to identify features predictive of hospital and postdischarge outcomes in a cross-sectional approach. In our cohort of over 5,000 patients receiving surgery for intradural spinal tumors, we developed and validated risk classification models integrating individual predictors within a unified predictive framework to anticipate nonhome discharge and readmission within 90 days of discharge. These models offer opportunities to patient-specific risk of postoperative complications while potentiating future efforts to optimize quality and efficiency of care delivery.
MATERIALS AND METHODS
This study was approved by the Institutional Review Board of Stanford University (No. 40974) and complies with guidelines established by the Health Insurance Portability and Accountability Act. Patient consent was not required as only deidentified data was used. Adult patients receiving spine surgery for resection of intradural tumors between 2007 and 2016 were identified in the IBM MarketScan Claims Database, which we have previously described [9,10]. Inclusion criteria required an inpatient procedure code indicating either laminectomy or corpectomy for intradural lesion removal concurrent with a diagnosis code indicating spinal neoplasm (Supplementary Table 1). Concurrent anterior and posterior approach codes were classified as combined approach. Tumor location was identified by current procedural terminology (CPT) identifier while tumor type and grade were determined by International Statistical Classification of Diseases (ICD)-9/10 identifiers. Tumor type was classified as either meningioma, primary spinal cord/nerve sheath tumor, or metastasis. Comorbidities were assessed according to the Elixhauser comorbidity index, which defines a set of comorbid conditions most associated with outcomes and resource use [11]. Other variables considered include use of an operating microscope, intraoperative neuromonitoring, and postresection arthrodesis. Discharge disposition was stratified as either home discharge or nonhome discharge (e.g., inpatient rehabilitation, skilled nursing facility [SNF], or other healthcare facility). Analyses of postdischarge outcomes required at least 90 days of continuous postdischarge follow-up. Planned readmissions for physical rehabilitation, radiotherapy, or chemotherapy were not considered (ICD-9: V57, V58.0, V58.1, ICD-10: Z51.0, Z51.1, Z51.8). New-onset paralysis or paresis was identified by the presence of corresponding ICD-9 or ICD-10 identifier after surgery that were not present at any time prior to surgery. Secondary analyses included evaluation of predictors associated with either new-onset paralysis/paresis or wound infection. Only patients with non-null values for all noncomorbidity predictors were included. Primary inpatient outcomes include postsurgical inpatient stay duration and discharge disposition. Our secondary outcome-of-interest was hospital readmission within 90 days following the initial index encounter.
1. Statistical Analysis
Wilcoxon rank-sum and chi-square tests were used to evaluate differences in continuous and categorical variables, respectively. Trends over time were evaluated using Pearson correlation coefficient. Multiple regression was used to evaluate factors associated with prolonged inpatient stay, index admission cost, and 90-day postdischarge costs. Multivariable logistic regression was used to assess factors associated with nonhome discharge (defined as rehabilitation, SNF, or another healthcare facility), risk of postdischarge complications, and risk of postoperative readmissions. All p-values are 2-sided and threshold for statistical significance was established at an α of 0.05. Statistical and graphical analyses were conducted using R (ver. 3.6.0, R Foundation for Statistical Computing, Vienna, Austria) and GraphPad Prism 8 (GraphPad Software, San Diego, CA, USA).
2. Predictive Modeling
The full cohort was randomly split into a 70% training dataset and a 30% validation dataset, which was not used in model training. Binary classification models were developed using a logistic regression approach regularized by the least absolute shrinkage and selection operator (LASSO) penalty [12]. In brief, LASSO offers both variable selection and regularization to optimize model accuracy and parsimony by incorporating the additional penalty term
Input features were classified as either patient-specific, tumor-specific, or other. Discharge disposition was only included in the input feature set for predicting postdischarge readmissions (nonhome discharge was the outcome variable for the other model). Internal validation of the models was conducted on the withheld 30% validation subset. Model discrimination was evaluated using receiver operating characteristic (ROC) curves and associated area under the curves (AUCs). AUC values range from 0.5, which represents random choice, to 1.0, representing perfect discrimination. Prediction accuracy was evaluated using Brier scores, which measures the mean-squared-error of predictions (compared to empiric outcomes). Brier scores closer to 0 indicate lower prediction errors, reflecting higher model accuracy. Furthermore, we simulate risk stratification by defining percentile groups in the validation subset and computing empiric frequency of outcomes-of-interest (nonhome discharge and 90-day readmissions). To interrogate variable importance, model coefficients were computed following standardization of input data by each covariate’s variance. As presented, higher standardized coefficients represent increased importance and negative values indicate features that inversely associate with the outcome-of-interest.
Risk groups were defined a priori using the following 5 strata scheme: the highest- and lowest-risk groups were defined as the top and bottom 10% cases ordered by predicted risk, respectively. Medium risk was defined as the middle 50% of all patients (25th to 75th risk percentile) while the final 2 risk strata comprised patients on the low-medium (10th to 25th percentile) and medium-high (75th to 90th percentile) spectrum. For models achieving a validation set AUC of at least 0.700, conversion of logistic regression coefficients into numerical risk scales was performed using the method described by Sullivan et al. [13]. All model development and validation was performed in R (ver. 3.6.0) using the glmnet [14], rms [15], and pROC [16] packages.
RESULTS
1. Cohort Characteristics
A total of 5,060 patients receiving resection of intradural spinal tumors were identified (Table 1). Tumors of the thoracic (n=1,941, 38.4%) and lumbar spine (n=1,781, 35.2%) were most common, followed by cervical tumors (n=1,294, 25.6%). Spinal cord/nerve sheath tumors (n=3,072, 60.7%) and meningiomas (n=1,521, 30.1%) constituted the vast majority of the cohort and majority were benign (n=3,025, 59.8%) while 862 (17%) were malignant. Tumor grade was not available for 1,173 lesions (23.2%). The majority of tumors were extramedullary (n=3,757, 74.2%). Operating microscope (n=3,150, 62.3%) and intraoperative neuromonitoring (n=2,862, 56.6%) use was common. While there was no change in frequency of microscopic surgery between 2007 and 2016 (62.1% to 65.0%, p=0.314), use of intraoperative neuromonitoring increased significantly between 2007 and 2016 (46.7% to 64.7%, p<0.001) (Fig. 1A, B).

Cohort characteristics of patients receiving resection of intradural tumors

Cohort summary and contributors to increased hospitalization duration. (A) Trends in operative microscope and intraoperative neuromonitoring use. (B) Slope and 95% confidence intervals reflect the line-of-best-fit. Multivariable assessment of variable contributions to postsurgical hospitalization length is presented. Comorbidities not depicted (see Supplementary Table 2). CI, confidence interval; NOS, not otherwise specified.
2. Discharge Timing and Disposition
Median length of postsurgical hospital stay was 4 days (95% confidence interval [CI], 1–18) and most patients were discharged to home (n=3,767, 74.4%). Malignant tumor grade (B=1.763; 95% CI, 1.259–2.268), cervical or thoracic location (B[cervical]=0.645; 95% CI, 0.239–1.050, B[thoracic]=0.502; 95% CI, 0.140–0.864), intramedullary location (B=1.250; 95% CI, 0.857–1.643), and certain comorbidities (e.g., pulmonary circulation disorders, paralysis, other neurological disorders, unexpected weight loss, fluid and electrolyte disorders, and depression) were independently associated with longer hospitalizations (Fig. 1C, full results in Supplementary Table 2). After adjusting for comorbid conditions, demographics, and tumor-specific factors, neither anterior (B=2.109; 95% CI, -0.803 to 5.021) nor combined (B=1.576; 95% CI, -4.406 to 7.557) surgical approach was associated with longer postsurgical inpatient stay. Operating microscope use (B=-0.850; 95% CI, -1.169 to -0.531) was associated with shorter stay duration while intraoperative neuromonitoring did not independently impact length of hospitalization.
A minority of patients were discharged to either rehabilitation (n=603, 11.9%) or to a SNF or other nonhome care facility (n=353, 7.0%). On multivariable analysis, demographic and lesion-specific factors independently associated with nonhome discharge (either rehabilitation, SNF, or other nonhome care facility) include older age (continuous; OR, 1.026; 95% CI, 1.020–1.033), female sex (vs. male; OR, 1.291; 95% CI, 1.110–1.503), malignant tumor grade (vs. benign; OR, 1.684; 95% CI, 1.349–2.104), cervical location (vs. lumbar location; OR, 1.993; 95% CI, 1.629–2.438), and thoracic location (vs. lumbar location; OR, 2.456; 95% CI, 2.047–2.945) (full results in Supplementary Table 2).
To simulate a predictive model for anticipating nonhome discharge, we trained a LASSO-penalized logistic regression classifier on a set of patient, hospitalization, and tumor features (Table 2) and tested model performance on the withheld validation subset. In withheld cases, the integrated classifier achieved an AUC of 0.786 (Fig. 2A). By comparison, classification using only tumor- or patient-level features performed significantly worse. The final model optimized model included a total of 20 features (Supplementary Fig. 1A, B) and calibration of the model was robust (Supplementary Fig. 2A). Similarly, prediction accuracy was best for the integrated model (Brier score= 0.155 vs. 0.166 [tumor features only] and 0.173 [patient features only]). Empirically, patients anticipated by our model to be at highest risk were discharged to continued care 64.5% of the time compared to 4.0% of the time in the lowest risk subset (Fig. 2B). After normalization each feature by its variance, the characteristics most contributory to model prediction were postsurgery hospitalization length, patient age, and intramedullary location (Fig. 2C), further demonstrating the importance of aggregating diverse clinical features for risk assessment. To further improve model accessibility, we derived a numerical risk scale from the coefficients of the LASSO regression fit (Table 3). Conversion of summed risk scores into empiric nonhome discharge risk is presented in Table 4; subsequent application of this scale to both the training and validation sets demonstrates good risk stratification between risk score groups (Fig. 3).
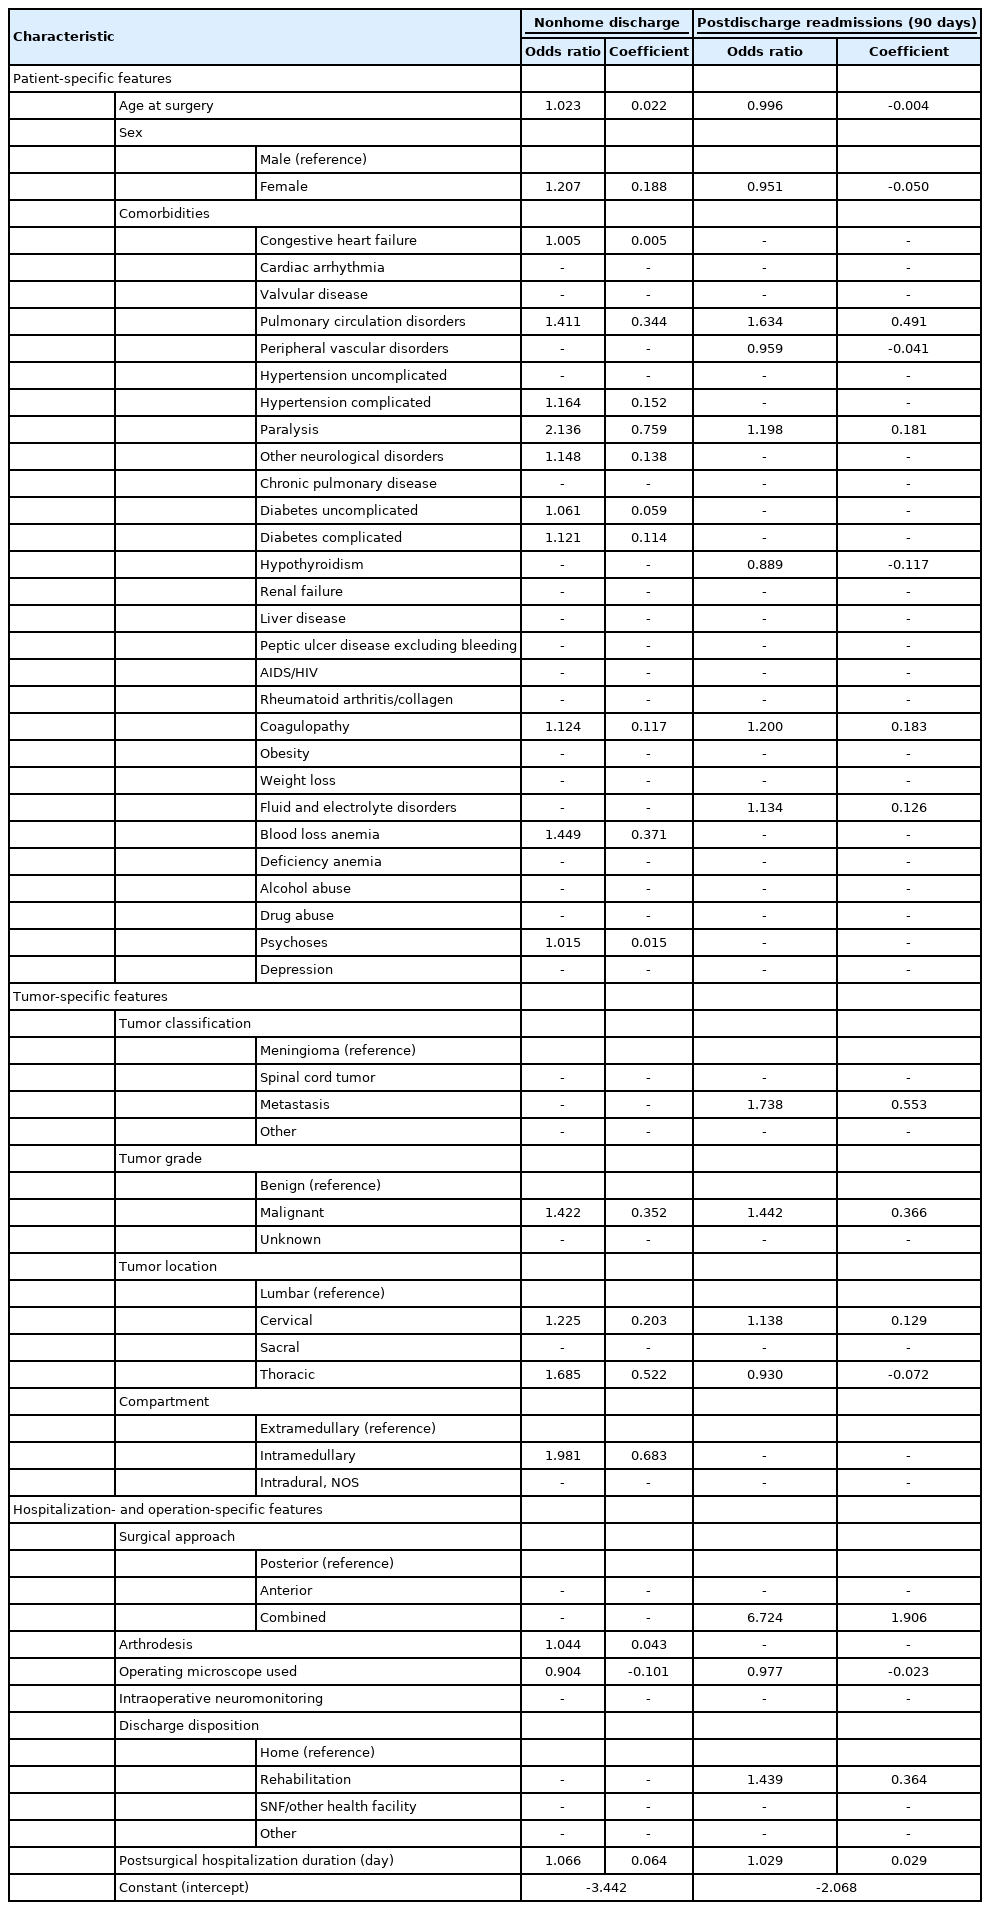
Components of the LASSO logistic regression models trained to predict nonhome discharge and postdischarge readmission

Predictive modeling of nonhome discharge. Model performance for predicting nonhome discharge following intradural tumor resection was evaluated in the withheld validation subset. (A) Integrated model discrimination was compared to that of models utilizing only feature subsets. Empiric nonhome discharge rates were computed based on predicted risk strata (B), and the top 8 contributing features are visualized (C). AUC, area under the curve.

Numerical risk score for stratifying nonhome discharge risk

Conversion table for estimated risk of nonhome discharge
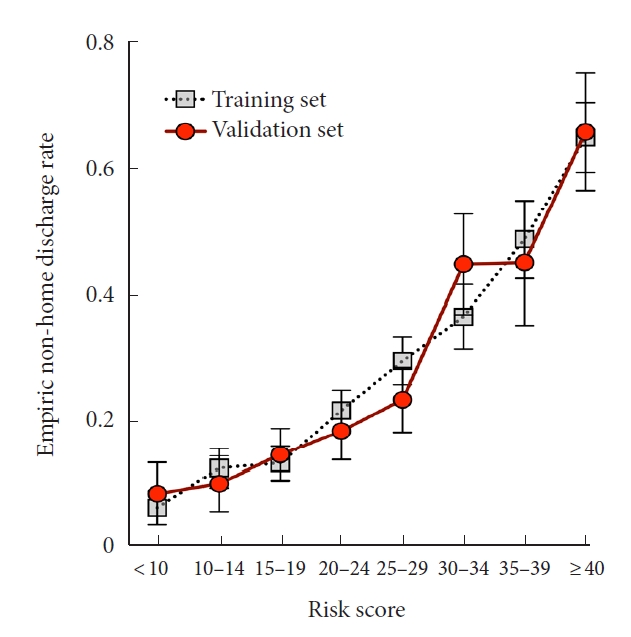
Application of nonhome discharge numerical risk score for prediction of nonhome discharge. Conversion of numerical risk scores to empiric nonhome discharge risk demonstrates good stratification in both training and validation subsets.
3. Readmissions and Postsurgery Complications
A total of 4,488 patients (88.7%) had at least 90 days of continuous postdischarge follow-up. Of patients with sufficient continuous postdischarge follow-up, 524 patients (11.7%) were readmitted within 90 days. Most frequent causes for readmission include cerebrospinal fluid leaks (11.6%) and surgical site infections (9.7%). After adjusting for demographics, comorbidities, and tumor-specific covariates, operating microscope use remained prognostic for decreased risk of 90-day readmissions (OR, 0.798; 95% CI, 0.649–0.982, results summarized in Supplementary Table 3). Tumor characteristics associated with higher risk of readmission include metastasis (OR, 2.516; 95% CI, 1.585–3.993), malignant grade (OR, 1.964; 95% CI, 1.462–2.638), and cervical location (OR, 1.492; 95% CI, 1.152–1.933). Intramedullary location was not associated with higher readmission risk (OR, 1.087; 95% CI, 0.850–1.389).
Incidence of postoperative paralysis or paresis and wound infection were 6.4% and 3.3%, respectively. Tumor characteristics associated with higher odds of postoperative paralysis or paresis include spinal cord/nerve sheath tumors (vs. meningioma; OR, 1.658; 95% CI, 1.128–2.437), metastases (vs. meningioma; OR, 2.236; 95% CI, 1.203–4.388), malignancy (vs. benign; OR, 1.618; 95% CI, 1.114–2.351), cervical or thoracic location (vs. lumbar; OR [cervical], 2.765; 95% CI, 1.825–4.192; OR [thoracic], 3.557; 95% CI, 2.414–5.240), intramedullary location (vs. extramedullary; OR, 2.721; 95% CI, 2.006–3.691) (Supplementary Table 4). Microscopic surgery did not was associated with reduced odds of new-onset postsurgical paralysis or paresis (OR, 0.991; 95% CI, 0.687–1.207) or surgical site infections (OR, 0.760; 95% CI, 0.533–1.085). The most significantly prognostic variable of postoperative surgical site infections was year of admission, with a trend towards reduced infections in more recent surgeries (continuous; OR, 0.866; 95% CI, 0.804–0.933). Intraoperative neuromonitoring did not affect risk of postsurgical paresis or surgical site infections. Separate analyses of extramedullary and intramedullary tumors also did not reveal improved motor recovery associated with intraoperative neuromonitoring (OR [intramedullary], 0.995; 95% CI, 0.579–1.709; OR [extramedullary], 1.019; 95% CI, 0.689–1.508).
Using a LASSO-penalized logistic regression framework and characteristics available at discharge, we developed a predictive model to anticipate risk of readmission within 90 days of discharge (Table 2). Classification performance of the integrated model vastly outperformed models with more limited input features (AUC=0.693, Fig. 4A). Prediction accuracy was also maximized by the integrated model (Brier score=0.093) compared to the models incorporating only tumor (Brier score=0.093) or patient features (Brier score=0.099). Empirically, of those predicted to be at highest risk of readmissions, 32.6% were eventually readmitted within 90 days of discharge (Fig. 4B). By comparison, only 4.4% of those predicted to be at lowest risk were readmitted within 90 days of discharge. Of the features selected for the final model, postsurgical hospitalization length, tumor malignancy, and discharge to rehabilitation were among the most significant predictors of readmissions (Fig. 4C). Performance on training data and model calibration are included in Supplementary Fig. 1C, 1D, and Supplementary Fig. 2B, respectively.
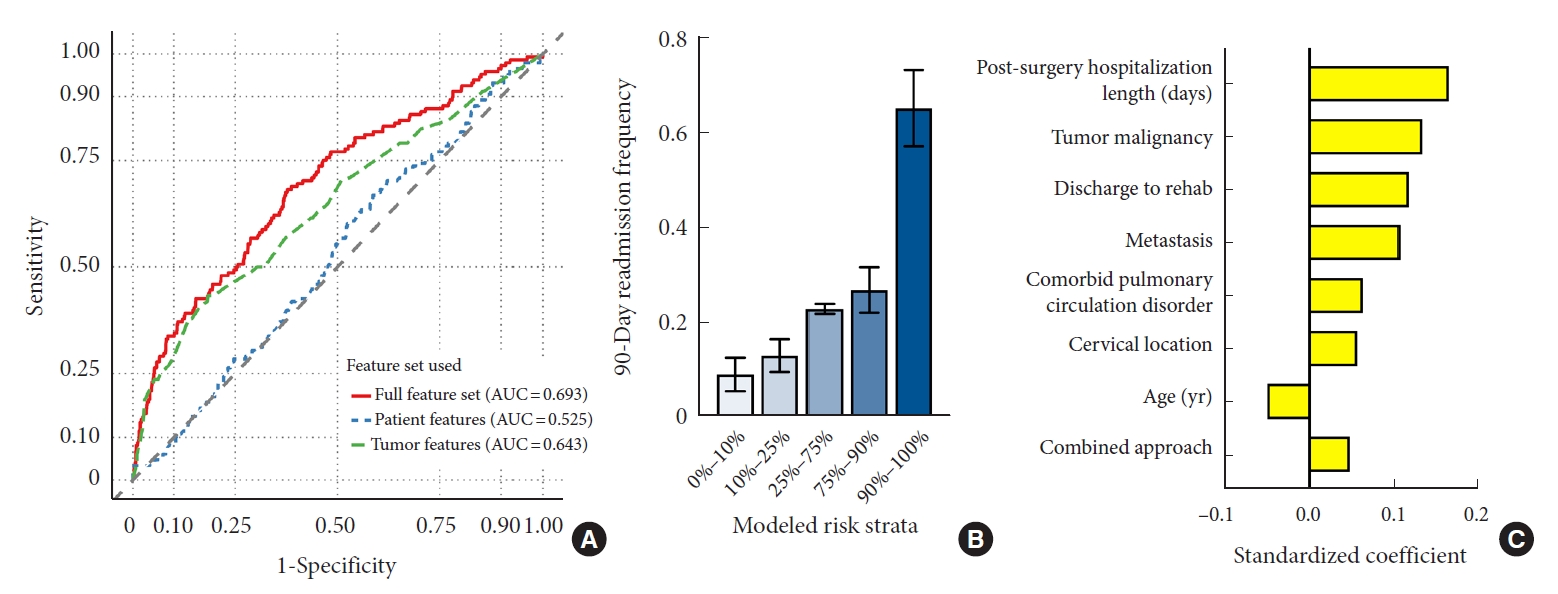
Predictive modeling of postdischarge readmissions. Model performance was evaluated on the withheld validation subset. (A) Discrimination ability was compared between the integrated risk model and models utilizing only feature subsets. Empiric 90-day readmission frequency was computed based on predicted risk strata (B), and the top 8 contributing features are visualized (C). AUC, area under the curve.
DISCUSSION
In a nationwide study of over 5,000 intradural tumor resections, operative-, tumor-, and patient-specific variables were interrogated to understand their impact on inpatient and postdischarge outcomes. From an expansive feature set spanning diverse patient, tumor, and hospitalization characteristics, we developed 2 predictive models to anticipate nonhome discharge and postdischarge readmissions. In a validation set of withheld cases, those at highest risk for nonhome discharge were 16.3 times as likely to require continued care compared to those at lowest risk. Similarly, patients predicted to be at highest risk for readmissions within 90 days of discharge eventually were readmitted 7.3 times as often as their lowest risk counterparts during the 90 days following discharge.
1. Assessing Predictors of Nonhome Discharge and Readmissions
Prior studies examining the effect of tumor-specific characteristics on outcomes following resection of intradural neoplasms have generally been from either small single-institute cohorts or inpatient-focused databases such as the Nationwide Inpatient Sample or the National Surgical Quality Improvement Program. Single-institute studies often lack the cohort size necessary to explore the contributory effect of each tumor characteristic to postsurgical outcomes and conclusions tend to be descriptive and qualitative in nature [17-24]. However, few of these studies were powered to conduct robust multivariable analyses. In an analysis of 221 spinal nerve sheath tumors, Safaee et al. [24] identified cervical tumor location as being associated with lower rates of gross total resection, which resulted in higher rates of tumor recurrence. Postoperative and postdischarge complications were separately evaluated in a subsequent study [21]; however, results of multivariable analyses were not presented.
Most frequently employed for the removal of cervical intradural tumors [25-28], anterior tumor resection allows for improved access to lesion ventral to the spinal cord via corpectomy, obviating the need for cord manipulation. Disadvantages to anterior approaches include the need for vertebral stabilization through fusion and potentially increased risk of cerebrospinal fluid leaks given the added complexity of repairing anterior spinal dura. Combined anteroposterior approaches have also been used for resection of complex dumbbell tumors, which describe lesions with components in both the spinal canal and the paravertebral space [29]. In our study, neither anterior nor combined surgical approach was associated with longer hospital stays. However, in our predictive model of postdischarge readmissions, combined approach surgery was the eighth most important feature. This is likely a combination of increased surgical complexity and the underlying tumor characteristics requiring a nonposterior approach.
Intraoperative neuromonitoring did not affect hospitalization length, discharge disposition, or 90-day readmissions in our study, despite a significant increase in usage between 2007 and 2016. Prior studies have explored and supported potential therapeutic utility of intraoperative sensory and motor neuromonitoring for cranial procedures, including intracranial tumor resection [30,31] and open cerebrovascular surgery [32]. While numerous of studies have demonstrated diagnostic value associated with use intraoperative neuromonitoring during resection of spinal tumors, its therapeutic value remains uncertain. In 2 prior retrospective studies of extramedullary and intramedullary tumor, respectively, Choi et al. [33] and Harel et al. [34] did not observe any therapeutic benefit in patients receiving neuromonitoring,. More broadly, guideline recommendations acknowledge the utility of neuromonitoring as a diagnostic, but not therapeutic, adjunct during spine surgery [35]. Our study did not uncover any observable benefit in either intramedullary or extramedullary tumors but additional studies evaluating patient-reported outcome measures and functional status are necessary.
2. Developing Integrated Risk Models Harnessing Diverse Feature Sets
A broad-spanning archetype evident in these prior studies is that, while predictors and their individual contributions to outcomes-of-interest are assessed and quantified, there have been few studies exploring how these predictive features can be integrated into a unified model to guide clinical decision-making. In our study, we demonstrate the superiority of an expansive feature set compared to those limited to tumor- or patient-derived data, as the most significant contributors to model classification spanned tumor-, hospitalization-, and patient-level characteristics. Applying our model to a subset of withheld cases, patients predicted to be at highest risk for nonhome discharge were only discharged to home 34.5% of the time, compared to 96.1% of the time among patients at lowest predicted risk. Similarly, readmissions were significantly more frequent among those our model predicted to be at highest risk than in those predicted to be at lowest risk (32.6% vs. 4.4%). We anticipate that, with further external validation, these models could serve within an early risk stratification framework to identify higher risk patients; these patients may benefit from prompt intervention such as specialized surveillance programs with increased frequency of clinician follow-up or specialized postoperative recovery regimens with increased vigilance from patient caregivers. However, subsequent cost-benefit analyses will be required to understand the optimal risk threshold above which altered clinical care may be indicated.
Examination of the contributing features to each model reveals the diversity of data required to optimize prediction accuracy. Among the top 8 features in our model for predicting nonhome discharge were 3 patient-specific characteristics (age, sex, comorbid paralysis/paresis), 4 tumor-specific characteristics (intramedullary location, thoracic location, tumor malignancy, and cervical location), and 1 hospitalization/operative-specific characteristic (postsurgical hospital stay length). The top 8 features in our model for predicting postdischarge readmissions were similarly diverse, with 2 patient-specific characteristics (age, comorbid pulmonary circulation disorders), 3 tumor-specific characteristics (malignancy, metastatic disease, and cervical location), and 3 hospitalization/operative-specific characteristics (postsurgical hospital stay length, discharge to rehabilitation, and combined surgical approach). As evidenced by this heterogeneity, maximizing predictive model performance requires a diversity of input data and contributions from a collection of clinical variables. Extending upon prior studies that identified individual covariates associated with patient outcomes, our models demonstrate the potential utility of integrative approaches aggregating myriads of data points into a single unified outcome prediction.
We further improved the usability of our best performing model (prediction of nonhome discharge using a LASSO-regularized logistic regression) by converting it into a numeric risk score containing demographics, 9 comorbidities, and tumor/surgical characteristics. A companion reference table was provided grouping risk scores into strata along with corresponding nonhome discharge risk. Application to training and validation cohorts yielded comparable stratification and demonstrated robust ability to forecast discharge disposition. Particularly in the context of patient counseling and real time decision-making, we anticipate the availability of an easy-to-use risk scoring system will make point-of-care prediction of hospitalization course more accessible and interpretable.
3. Limitations and Strengths
The standard limitations associated with large-scale database studies apply to our study including the potential for miscoded variables and bias in patient coverage across regions and providers. Additionally, while multivariable models were used to adjust for available covariates, it is possible that residual selection bias remains due to variables not available in the database. Limitations associated with granularity of tumor characteristics must also be addressed, as important clinical characteristics, such as tumor size, histological subtype, and radiographic appearance, were not available. Specifically, preoperative functional status was also not available for assessment. Furthermore, our study adjusted for comorbidities according to the Elixhauser index to estimate burden of disease; however, precise documentation of patient characteristics at time of admission, such as severity of pain and sensorimotor disability, were not included in the database. More broadly, though the MarketScan database has been extensively explored in neurosurgical research [36-38], data used in our study was extracted from ICD-9, ICD-10, and CPT identifiers and clinical notes were not available to comprehensively adjudicate coding accuracy. Finally, while predictive modeling performance was evaluated in a withheld validation set not used for model training, additional external validation is necessary.
CONCLUSION
From a diverse set of predictive features, we developed 2 risk prediction models to predict nonhome discharge and postdischarge readmissions following resection of intradural spinal tumors. These integrative models significantly outperformed approaches using only tumor- or patient-level characteristics, emphasizing the need to translate discovery of predictive factors into clinically applicable models unifying heterogeneous clinical data into a single risk prediction. Pending further validation, applications of these models offer the potential to improve delivery of precise high-value care.
SUPPLEMENTARY MATERIALS
Supplementary Tables 1 and 2 can be found via https://doi.org/10.14245/ns.2143244.622.
ICD/CPT codes used in study cohort definition
Regression models evaluating factors associated with hospitalization duration and discharge
Logistic regression assessing factors associated with postdischarge readmissions (90 days)
Logistic regressions assessing factors associated with postoperative paresis and surgical site infections
LASSO logistic regression training data performance and shrinkage factor selection. Application of the nonhome discharge model to training data achieves an AUC of 0.765 (A) using a cross-validated shrinkage factor of 0.01 (B). The postdischarge readmission model achieved an AUC of 0.689 on training data (C) using a cross-validated shrinkage factor of 0.01 (D). LASSO, least absolute shrinkage and selection operator; AUC, area under the curve.
Calibration plots comparing predicted and empiric risk for LASSO logistic regression models. Both LASSO logistic regression models for non-home discharge (A) and postdischarge readmission (B) demonstrated good calibration. LASSO, least absolute shrinkage and selection operator.
Notes
Conflict of Interest
The authors have nothing to disclose.
Funding/Support
This study received no specific grant from any funding agency in the public, commercial, or not-for-profit sectors.
Author Contribution
Conceptualization: MJ, AD; Data curation: MJ, AH, AD; Formal analysis: MJ, AH; Methodology: MJ, AD; Project administration: MJ, JR, AD; Visualization: MJ; Writing - original draft: MJ, AH, AF, AD; Writing - review & editing: MJ, AH, AF, ZM, AP, PR, JR, AD.