Quantitative Pfirrmann Disc Degeneration Grading System to Overcome the Limitation of Pfirrmann Disc Degeneration Grade
Article information
Abstract
Objective
Pfirrmann disc degeneration grade is one of morphologic disc degeneration grading system and it was reliable on routine T2-weighted magnetic resonance (MR) images. The purpose of this study was to evaluate the agreement of Pfirrmann disc degeneration grade, and check the alternative technique of disc degeneration grading system.
Methods
Fifteen volunteers (4 medical doctors related to spinal disease, 2 medical doctors not related to spinal disease, 6 nurses in spinal hospital, and 3 para-medicines) were included in this study. Three different digitalized MR images were provided all volunteers, and they checked Pfirrmann disc degeneration grade of each disc levels after careful listening to explanation. Indeed, all volunteers checked the signal intensity of disc degeneration at the points of nucleus pulposus (NP), disc membrane, ligaments, fat, and air to modify the quantitative Pfirrmann disc degeneration grade.
Results
Total 225 grade results of Pfirrmann disc degeneration grade and 405 signal intensity results of quantitative Pfirrmann disc degeneration grade were analyzed. Average interobserver agreement was "moderate (mean±standard deviation, 0.575±0.251)" from poor to excellent. Completely agreed levels of Pfirrmann disc degeneration grade were only 4 levels (26.67%), and the disagreement levels were observed in 11 levels; two different grades in 8 levels (53.33%) and three different grades in 3 levels (20%). Quantitative Pfirrmann disc degeneration showed relatively cluster distribution with the interobserver deviations of 0.41-1.56 at the ratio of NP and disc membrane, and it showed relatively good cluster and distribution indicating that the proposed grading system has good discrimination ability.
Conclusion
Pfirrmann disc degeneration grade showed the limitation of different interobserver results, but this limitation could be overcome by using quantitative techniques of MR signal intensity. Further evaluation is needed to access its advantage and reliabilities.
INTRODUCTION
The intervertebral discs are cylindrical, fibrocartilaginous, articulating structures connecting the vertebral bodies, and it can be divided microscopically into an outer annulus fibrosus surrounding a centrally located nucleus pulposus (NP)13). These essentially mechanical intervertebral discs undergo changes with ageing and degeneration13). Magnetic resonance imaging (MRI) is the most commonly used imaging modality for diagnosis of degenerative disc disease (DDD). And the most commonly used grading method by MR images was introduced by Pfirrmann et al.7818). Pfirrmann disc degeneration grade used the signal intensity on T2-weighted MR images to estimate water content with morphological parameters on a scale from I to V8). This grading system is comprehensive and easily applicable with sufficient reproducibility1213). But, this system proved relatively nondiscriminatory in elderly subjects and some ambiguity in categorizing disc degeneration10).
Morphological changes including loss of height of the intervertebral disc, annular tears, intervertebral disc bulging and osteophyte formation and the biochemical changes of NP decrease signal strength has been believed to reflect the intervertebral disc degeneration15). They are suitable for qualitative assessment, but they cannot easily be used for the quantitative evaluation14). Indeed, the detection of the modification of the initial stage will be difficult because they will be displayed at a later stage of intervertebral degeneration. But the change in the signal strength of the NP, which represents the biochemical changes, used for easily quantitative evaluation than the other parameters at an early stage14). The overall agreement rate of Pfirrmann disc degeneration grade is excellently in the literatures81213). But, during the data collection in degenerative spine study, the Pfirrmann disc degeneration grade is very subjective method. The brightness and distinction of NP to disc membrane is the main difference between 5-graded Pfirrmann disc degeneration grade, but this categorization is easily be influenced by the different observers or investigators. In this study, the author tested interobserver reproducibility of Pfirrmann disc degeneration grade to determine this reliability. Furthermore, the application of quantitative signal intensity technique to supplement the possible limitation of Pfirrmann disc degeneration grade.
MATERIALS AND METHODS
Fifteen volunteers were included in this study to investigate Pfirrmann disc degeneration grade and quantitative Pfirrmann disc degeneration grade. The volunteers were composed as 4 medical doctors related to spinal disease, 2 medical doctors not related to spinal disease, 6 nurses in spinal hospital, and 3 para-medicines. The author explained to each volunteers about the purpose of this study, the medical usage of Pfirrmann disc degeneration grade, and the new concept of quantitative Pfirrmann disc degeneration grade by person to person. Sheets of brief medical information contained Korean translated description, table, the algorism and the sample images in original article were provided to all volunteers18). After clear communication of this study, each volunteers were provided three different digitalized MR T2-weighted spine echo images (Fig. 1), and checked own considered Pfirrmann disc degeneration grade of each disc levels. Each volunteers did not discussed what they were checked on the degeneration grade, and only the author could observe the results of volunteers.
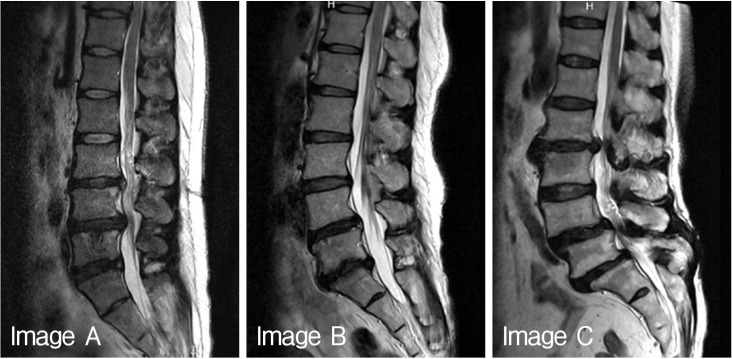
Three digitalized magnetic resonance images provided to volunteers.
Quantitative Pfirrmann disc degeneration grade also checked as same manor using same three digitalized MR T2-weighted spine echo images (Fig. 1). Sheets of brief medical information about MR signal intensity and the sample areas to measure the signal intensity were provided to all volunteers (Fig. 2). After clear communication of checking quantitative Pfirrmann disc degeneration grade, all volunteers checked the signal intensity of disc degeneration at the areas of NP, disc membrane, ligaments, fat, and air to modify the quantitative Pfirrmann disc degeneration grade. Each volunteers also did not discussed of what they were checked on the signal intensity of each point, and only the author could observe the results.

Sample image to check magnetic resonance signal intensity of neucleus pulposus (NP), disc membrane, ligaments, fat, and air.
The signal intensity of MR based image was checked using the medical image programs (PACSPLUS, Medical Standard, Seongnam, Korea). All images were midline positioned sagittal T2-weighted images which easily checkable the desired structures (Fig. 2). The signal intensity area of NP was defined as the different MR intensity of distinction area between inner and outer fibers of annulus at disc space. Although, the definition is very obscure such as the areas of NP, but, the recommend lesion was the homogenous center portion of NP with some distance from the bone edge. The signal intensity area of disc membrane was defined as the darkest area located in the middle anterior portion of disc space within 3-mm width. The signal intensity area of ligaments was defined as the most well visualized homogenous interspinous ligaments which located between the posterior spinous process. The signal intensity area of fat and air were defined as the most distinctive subcutaneous fat layer and air in posterior outside of body. All desired areas were checked the signal intensity using the function of region of interest (ROI) property in the image software program(PACSPLUS).
The results are expressed as I to V in Pfirrmann disc degenerative grade and the mean±standard deviation (SD) in quantitative Pfirrmann disc degeneration grade. Weighted kappa test was used to assess the interobserver reproducibility using Microsoft Excel 2013 and VassarStats (website for statistical computation http://vassarstats.net/kappa.html). A kappa >0.800 or <0.200 was considered as an excellent or poor agreement.
RESULTS
Total 225 Pfirrmann disc degeneration grades and 405 Pfirrmann disc degeneration grades was resulted (Table 1). The result of Pfirrmann disc degeneration grade in MR images were grade I (6.66%), grade II (46.67%) or grade III (46.67%) at the level of L1/2; grade II (80%) or grade III (20.00%) at L2/3; grade III (46.67%) or grade IV(53.33%) at L3/4; grade IV(100%) at L4/5 and 5/S1 in image A: grade II (13.33%) or grade III (86.67%) at L1/2; grade II (6.67%) or grade III (93.33%) at L2/3; grade II (6.67%), grade III (80.00%) or grade IV(13.33%) at L3/4; grade IV(100%) at L4/5; grade IV(40.00%) or grade V (60.00%) at L5/S1 in image B: grade III (80.00%) or grade IV (20.00%) at L1/2; grade III (13.33%), grade IV(66.67%) or grade V (20.00%) at L2/3; grade III (100.00%) at L3/4; grade IV(93.33%) or grade V (6.67%) at L4/5; and grade IV(26.67%) or grade V (73.33%) at L5/S1 in image C. Average interobserver agreement was "moderate" for all volunteers ranged from poor to excellent, with kappa values ranging from 0 to 1.000 (mean±SD, 0.575±0.251) (Table 2). Completely agreed levels of Pfirrmann disc degeneration grade were observed only 4 levels (26.67%), and relatively disagreement levels were observed in 11 levels; two different grades in 8 levels out of 15 levels (53.33%) and three different grades in 3 levels out of 15 levels (20%).
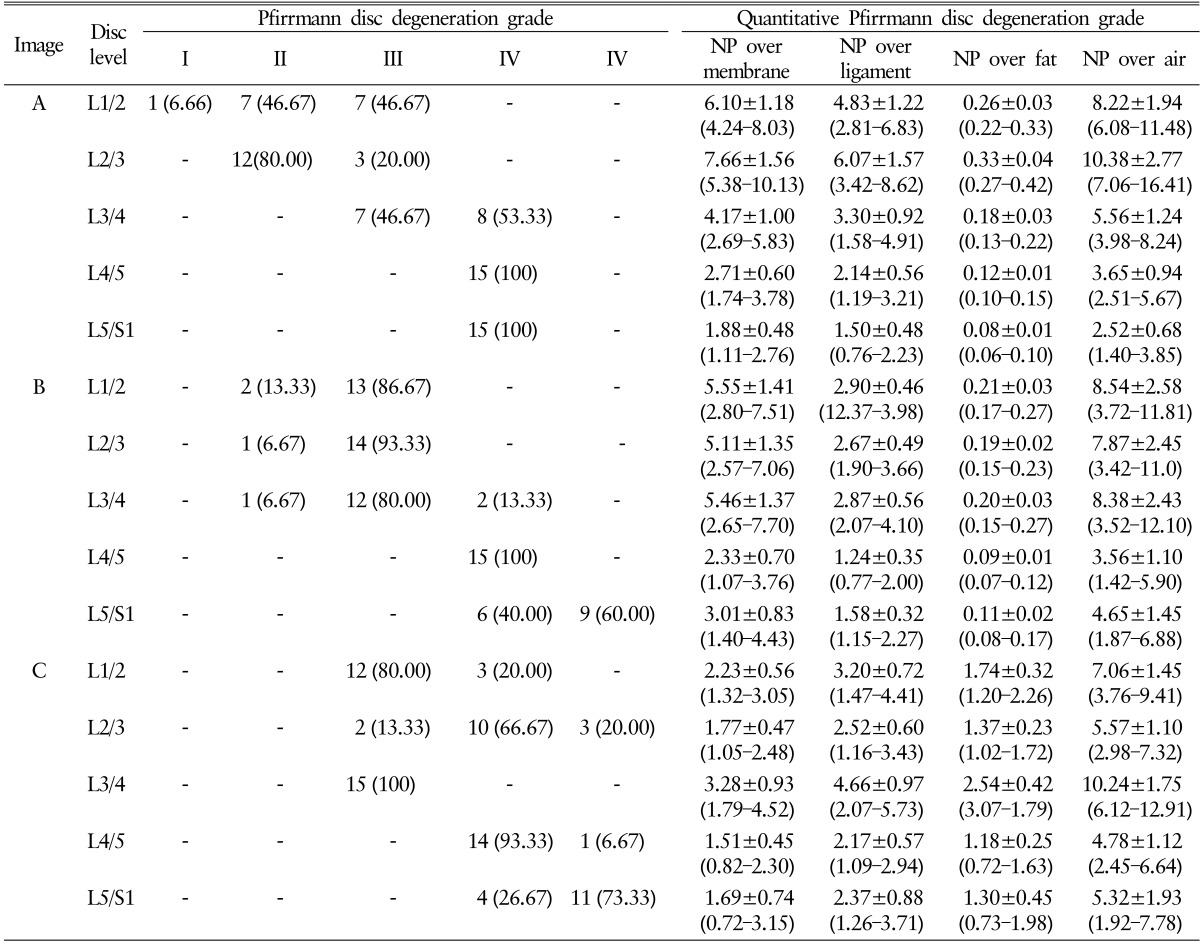
Pfirrmann disc degeneration grade and quantitative Pfirrmann disc degeneration grade by volunteers
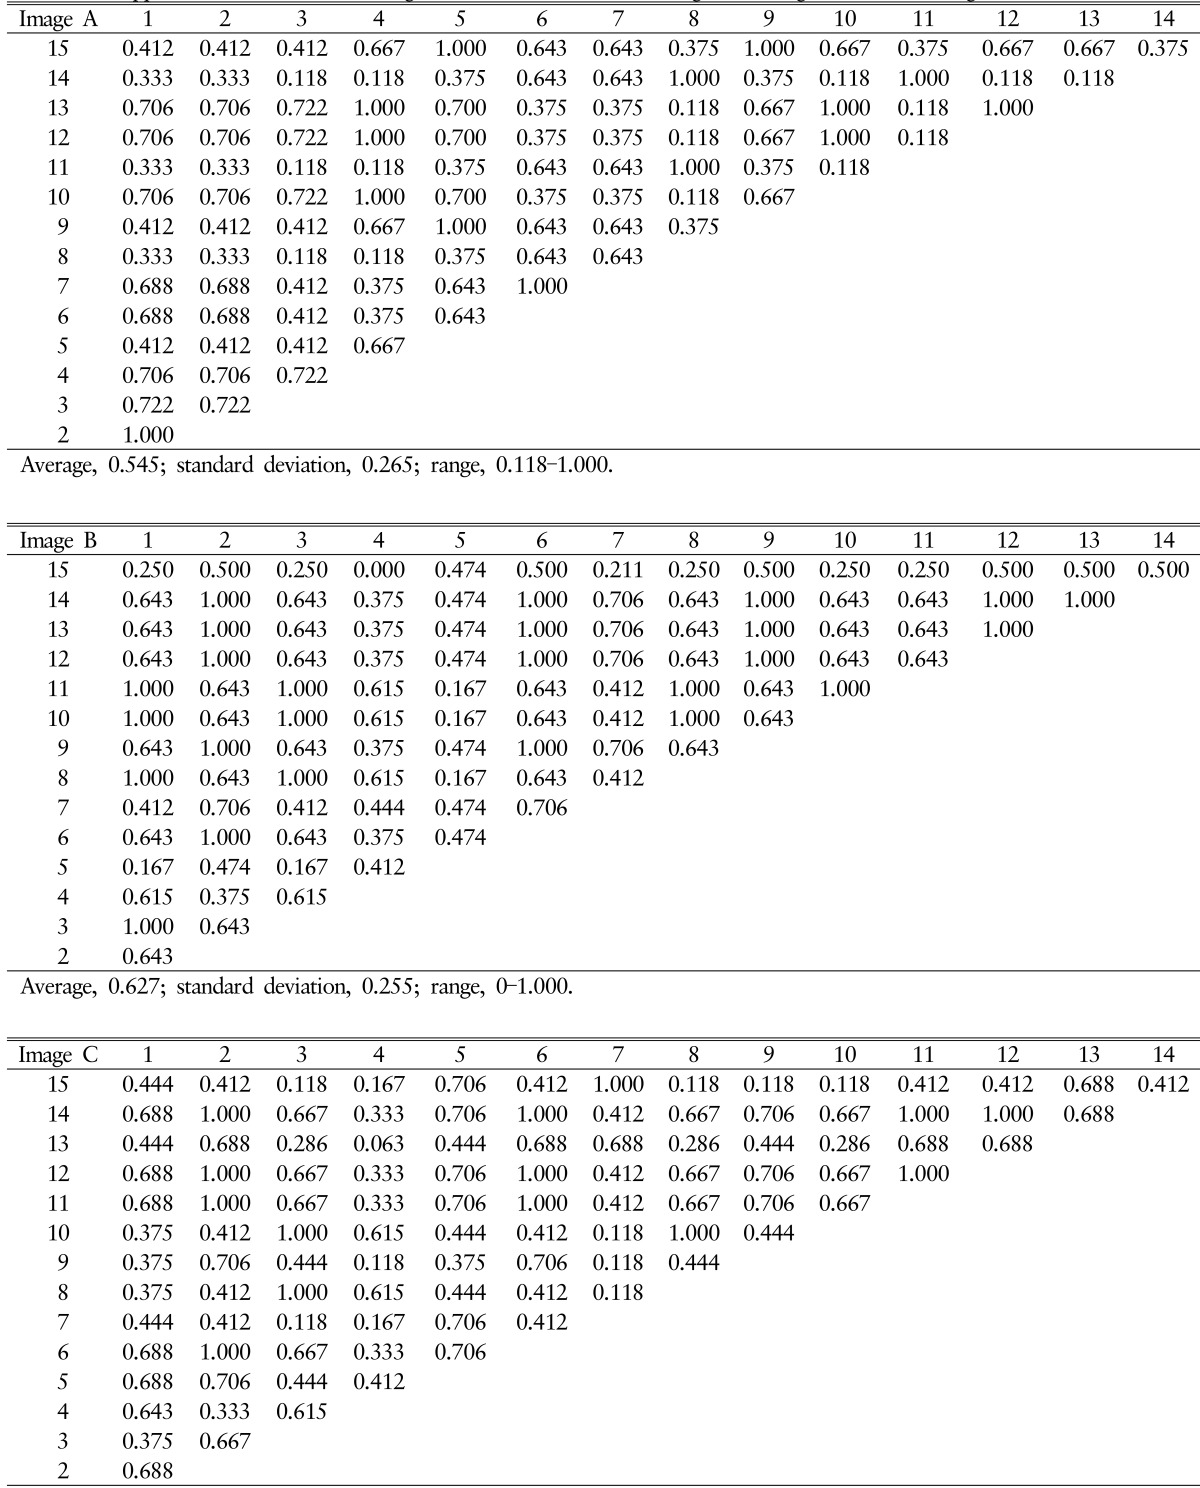
Kappa values in interobserver agreement of Pfirrmann disc degeneration grade in each images
The result of Pfirrmann disc degeneration grade check by 4 medical doctors related to spinal disease was shown in Table 3. Completely agreed levels of Pfirrmann disc degeneration grade were only 6 levels (40.00%), and relatively disagreement levels were observed in 9 levels with a difference of 1 grade. Although the interobserver agreement was more excellent in 4 medical doctors related to spinal disease compare to 15 volunteers, but it was also "moderate" agreement rates (mean±SD, 0.666± 0.474).
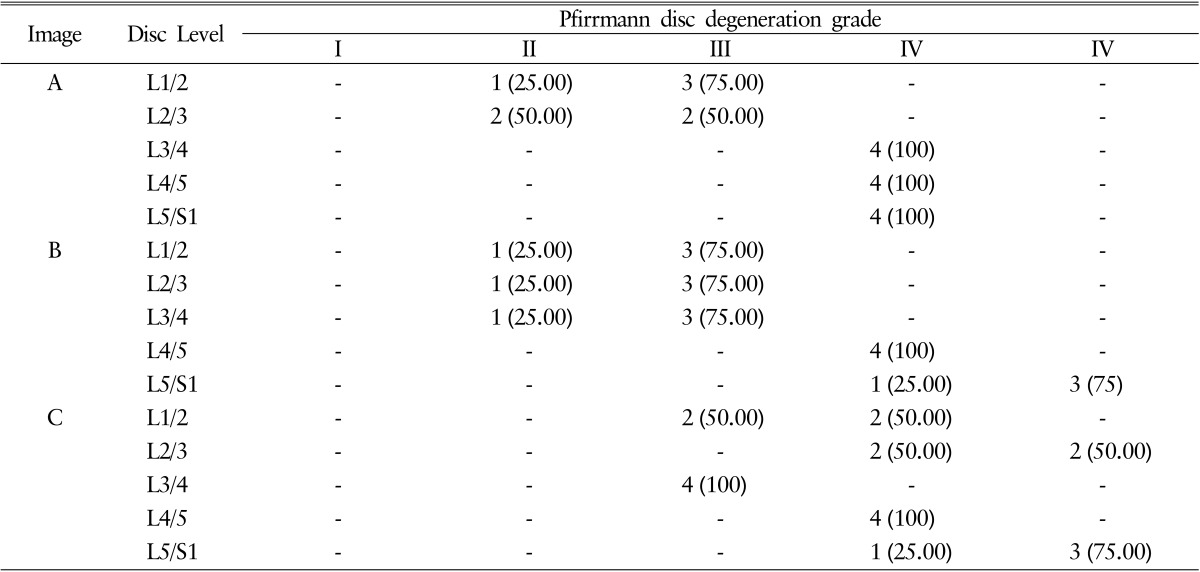
Interobserve correlation of Pfirrmann disc degeneration grade among 4 medical doctors related to spinal disease
Quantitative Pfirrmann disc degeneration showed relatively cluster distribution with the interobserver deviations. The checked ROIs in NP were 196.33±13.97 at the level of L1/2; 155.00±8.41 at L2/3; 287.27±24.33 at L3/4; 132.73±16.93 at L4/5; 147.33±46.14 at 5/S1 in image A: 312.33±12.17 at L1/2; 392.27±25.89 at L2/3; 212.67±21.87 at L3/4; 138.13±7.34 at L4/5; 96.00±15.19 at L5/S1 in image B: 254.40±12.23 at L1/2; 225.67±14.42 at L2/3; 241.67±14.54 at L3/4;103.07±15.21 at L4/5; and 134.07±22.08 at L5/S1 in image C. The checked quantified Pfirrmann disc degeneration grade based on disc membrane signal intensity in MR images were 6.10±1.18 (range, 4.24–8.03) at the level of L1/2; 7.66±1.56 (range, 5.38–10.13) at L2/3; 4.17±1.00 (range, 2.69–5.83) at L3/4; 2.71±0.60 (range, 1.74–3.78) at L4/5; 1.88±0.48 (range, 1.11–2.76) at 5/S1 in image A: 5.55±1.41 (range, 2.80–7.51) at L1/2; 5.11±1.35 (range, 2.57-7.06) at L2/3; 5.46±1.37 (range, 2.65–7.70) at L3/4; 2.33±0.70 (range, 1.07–3.76) at L4/5; 3.01±0.83 (range, 1.40–4.43) at L5/S1 in image B: 2.23±0.56 (range, 1.32–3.05) at L1/2; 1.77±0.47 (range, 1.05–2.48) at L2/3; 3.28±0.93 (range, 1.79–4.52) at L3/4; 1.51±0.45 (range, 0.82–2.30) at L4/5; and 1.69±0.74 (range, 0.72–3.15) at L5/S1 in image C (Table 1 and Fig. 3). Average interobserver agreement was "moderate (mean±SD, 0.575±0.251)" from poor to excellent as kappa 0 to 1.000. The distribution of quantitative Pfirrmann disc degeneration were 0.41-1.56 at the ratio of NP and disc membrane; 0.32-1.57 at the ratio of NP and ligaments; 0.01-0.45 at the ratio of NP and fat; and 0.68-2.77 at the ratio of NP and air (Table 1 and Fig. 3). Quantitative Pfirrmann disc degeneration is too clustered in the base of fat and too distributed in the base of fat, but it showed relatively good cluster and distribution in the base of disc membrane and ligaments indicating that the proposed grading system has good discrimination ability.
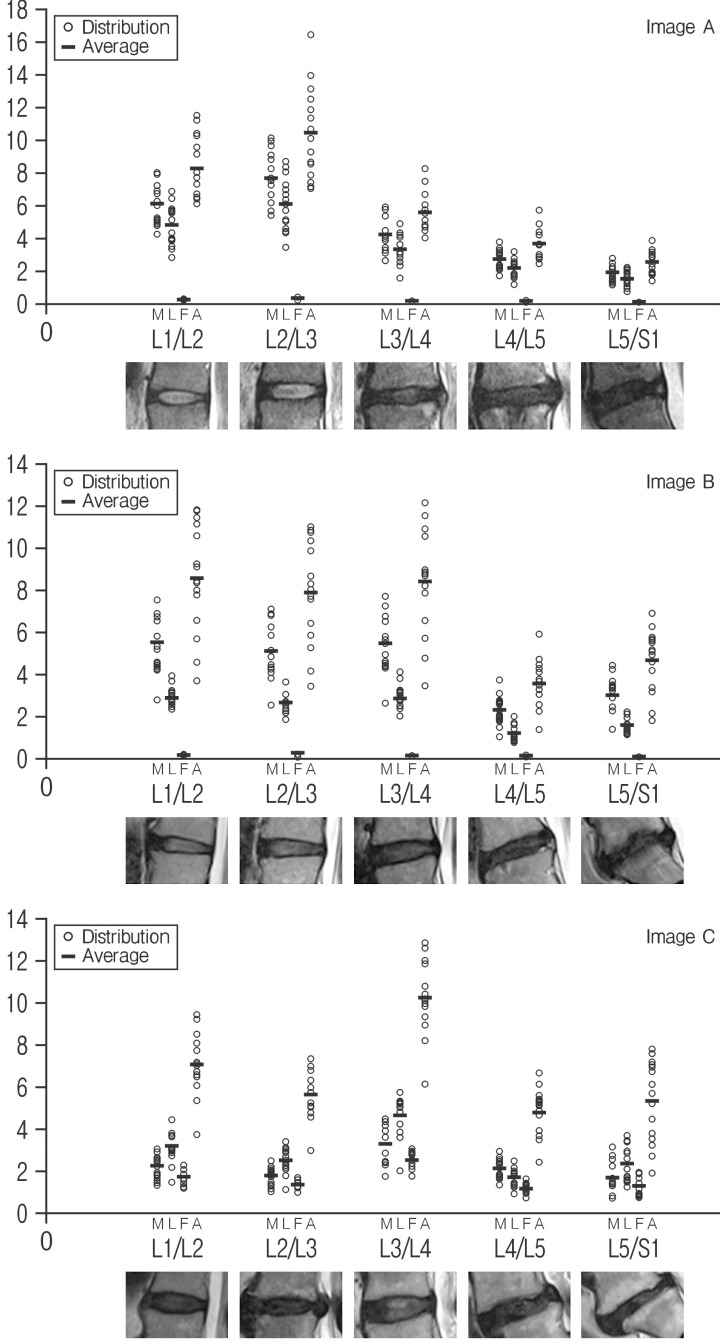
The distribution of quantitative Pfirrmann disc degeneration grade in images (M, the ratio of NP and disc membrane; L, the ratio of NP and ligaments; F, the ratio of NP and fat; and A, the ratio of NP and air). NP, neucleus pulposus.
DISCUSSION
Intervertebral disc degeneration plays an important role in low back pain and that severity of disc degeneration is broadly associated with severity of chronic symptomatology101727). The intervertebral disc is a cushion-like structure, and it consists of the NP, the annulus fibrosus, and the cartilaginous endplates6). The NP is composed of abundant sulfated glycosaminoglycans in a loose network of type II collagen10). The annulus fibrosus forms the outer boundary of the disc and is made up of coarse type I collagen fibers10). The proteoglycans of the nucleus osmotically exert a swelling pressure, which support spinal compressive loads10). During the disc degeneration, loss of proteoglycans and collagen type II is observed2). The slow poroelastic behavior is mediated by fluid flow, due to the binding and releasing of water by the proteoglycans in the nucleus19). The bound water in the nucleus generates an intradiscal osmotic pressure, which separates the vertebrae and tensions the annulus fibrosus1235112627).
A common definition of DDD is based on the appearance of the intervertebral disc on MRI10131420), because the signal loss of the disc on a T2-weighted image reflects a decrease of both proteoglycans and water content in the disc13). Depending on the stage of degeneration, structural changes in the disc and loss of disc height can be visualized on MRI3141820). Based on proton density, water content and chemical environment, MR depicts disc hydration and morphology2428). Analysis of the biochemical changes on the same specimens has suggested that MR reflects the proteoglycan content of the nucleus more closely than gross tissue morphology25). The brightness of the nucleus has been shown to correlate directly with the proteoglycan concentration, but not with the water or collagen content1016). The signal intensity of the disc in relation to chemical composition and histologic changes has been studied182024). The signal characteristics of the disc in T2-weighted MRIs reflect changes caused by aging or degeneration14161822). Disc degeneration is seen as a reduction in signal of the NP and inner fibers of the annulus10). This decreases the sharp distinction between the inner and outer fibers of the annulus10). With more severe disc degeneration, there is no demarcation between the inner and outer fibers of the annulus, and disc height decreases10). Early loss of signal intensity is not accompanied by a reduction in disc height, although later changes do show concordant loss of disc height9). Variations in disc hydration or composition can be detected noninvasively by quantitative MRI with sufficient accuracy4).
A number of morphologic grading systems for lumbar disc degeneration have been proposed. Pfirrmann et al.18) applied a grading system for disc degeneration based on MR signal intensity, disc structure, distinction between nucleus and annulus and disc height. The frequency of disagreement in discriminating grades was fairly uniform among the different levels. The interobserver agreements of this grading system were substantial to excellent101318). But, some limitations of this grading system were also reported. First, Pfirrmann disc degeneration grade proved relatively nondiscriminatory when examining more elderly subjects. Second, some ambiguity was encountered, based on the images and description provided, in categorizing disc degeneration as either one level or another10). So, some studies suggested that 8-level Pfirrmann grading system rather than 5-level Pfirrmann grading system for disc degeneration to assess disc degeneration in the elderly spine10).
In this study, quantitative Pfirrmann disc degeneration grade was checked by using signal intensity of disc degeneration at the areas such as NP and adjacent structures. Several experimental studies have proven a good correlation of T2 relaxation time values and water content in intervertebral disc tissue232429). The signal intensity area of NP was defined as the different MR intensity of distinction area between inner and outer fibers of annulus at disc space. Also, the definition of signal intensity area of NP is very obscure, signal intensity area of different NP regions did not show different T2 values in another quantitative morphologic study23). The geometrical center of the intervertebral area was matched to the center of intensity of the NP, and it also represents highest degree of sensitivity for quantifying intervertebral disc signal intensity on T2-weighted image14). Morphologic Pfirrmann disc degeneration is based on the distinct between NP and disc membrane, quantitative Pfirrmann disc degeneration based on the ratio between NP and adjacent structures could be helpful. In this study, quantitative Pfirrmann disc degeneration in the base of fat is too clustered and too distributed in the base of fat, but it showed relatively good cluster and distribution in the base of disc membrane and ligaments indicating that the proposed grading system has good discrimination ability. This tendency also observed in another study with similar values of annulus fibrosus between the different morphologic Pfirrmann disc degeneration grades from I to IV23).
The result in this study presented the poor to excellent interobserver agreement in Pfirrmann disc degeneration grade with kappa values ranging 0.575±0.251 (mean±SD) (Table 1). Indeed, the interobserver agreement in 4 medical doctors related to spinal disease also showed similar agreement rates 0.666±0.474 (mean±SD). Completely agreed levels of Pfirrmann disc degeneration grade were only 4 levels (26.67%), and the disagreement levels were observed in 11 levels (73.33%). But, quantitative Pfirrmann disc degeneration showed relatively cluster distribution. Quantitative grading showed relatively good cluster and distribution in the base of disc membrane (SD between 0.41-1.56) and ligaments (SD between 0.32-1.57) indicating that the proposed grading system has good discrimination ability. This quantitative measuring also provided additional advantage for checking DDD in the serial personal MR images. Disc degeneration is a continuum rather than a step-by-step process10). So, 5-level Pfirrmann grading system could provide only nondiscriminatory information when the DDD is not typical to pass the grading scale, but quantitative Pfirrmann grading system could provide continuum information about DDD. Indeed, a stepwise decrease in NP signal intensity values from Pfirrmann grade I to IV, with highly significant differences between each grade23).
Although, quantitative Pfirrmann grading system which proposed in this study was novel concept to DDD, but it has also some limitations. First, we could not check the interobserver correlation of this system, so we cannot clearly insist that quantitative Pfirrmann grading system is more superior to 5-level Pfirrmann grading system. Because, the comparison is not possible between moderate correlation of 5-level Pfirrmann grading system and quantitative result of quantitative Pfirrmann grading system. Second, quantitative Pfirrmann grading system provided useful information about the quality of NP, but it cannot provide the reduction in disc height which is usually observed in severe disc degeneration. As the result indicated, grades 4 and 5 DDD in 5-level Pfirrmann grading system showed similar quantitative result of quantitative Pfirrmann grading system. So, it was assumed that grades 4 and 5 DDD is not different disc pathology or additional disc height information should be combined in quantitative Pfirrmann grading system. Third, the ROI of NP or other structures also could be different to different observers. In this study, the definition is very obscure such as the areas of NP, but, this difference of ROI could be overcome by detailed definition such as the center of NP with distance to bone edge. But, nevertheless this limitation, quantitative Pfirrmann disc degeneration grade is expected that it can provide more reliable information about DDD. Indeed, the present method could be useful for longitudinal tracking of intervertebral disc degeneration with sufficient reproducibility14). Recently, a more sensitive biochemical imaging of intervertebral discs with glycosaminoglycan chemical exchange saturation transfer MRI is developed and investigated to overcome the limitation of the morphological MRI which were considered as well established and the most sensitive method for the clinical assessment of disc degeneration21). So, combined quantitative morphological evaluation and qualitative biochemical assessment could be useful for the evaluation of disc degeneration and its clinical grading in the future study.
CONCLUSION
Pfirrmann disc degeneration grade showed the limitation of different interobserver results, but this limitation could be overcome by using quantitative techniques of MR signal intensity. Quantitative Pfirrmann grading system seems to be able to characterize different degrees of disc degeneration quantitatively. The reproducibility of quantitative Pfirrmann grading system is sufficient to encourage the use of this method in future investigations, particularly for longitudinal studies. Further evaluation is needed to access its advantage and reliabilities.
ACKNOWLEDGMENTS
The author specially thanks to Chang Hyun Oh, MD, PhD who modified this article with great support.
Notes
CONFLICT OF INTEREST: No potential conflict of interest relevant to this article was reported.