 |
 |
- Search
|
|
||
Abstract
Objective
Methods
Results
Conclusion
ACKNOWLEDGEMENTS
SUPPLEMENTARY MATERIALS
Fig. 1.
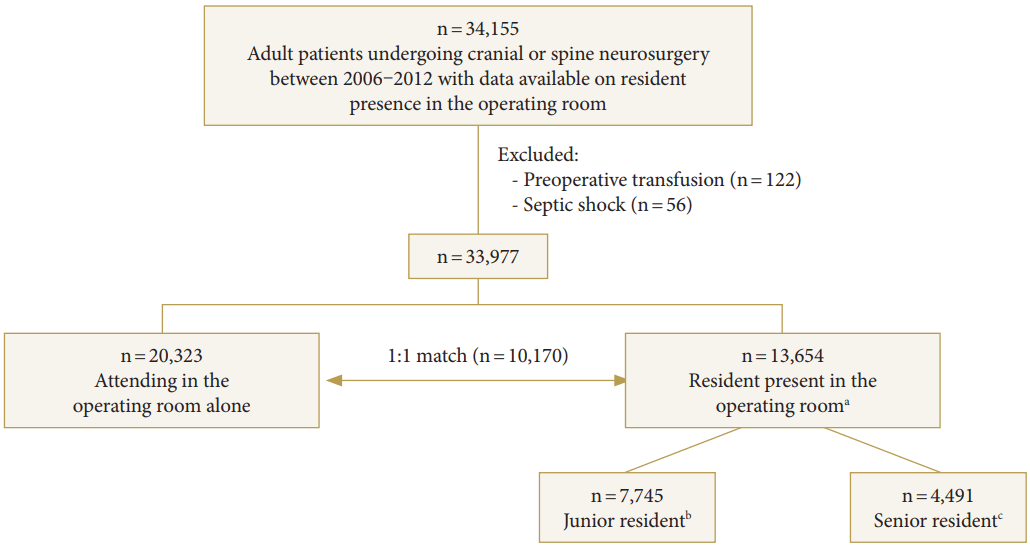
Fig. 2.
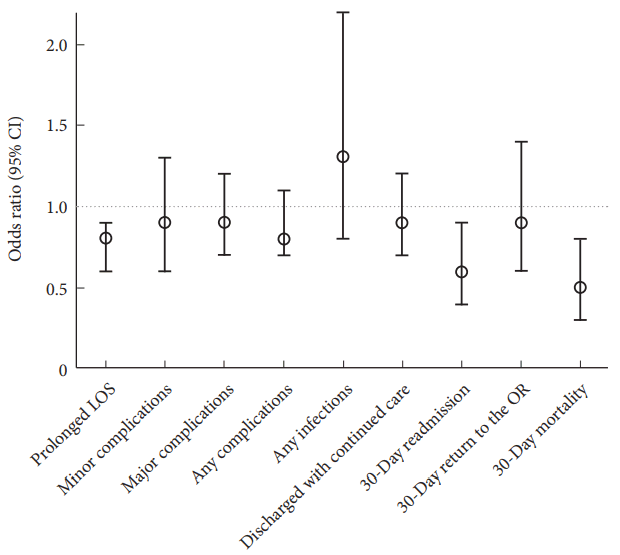
Fig. 3.
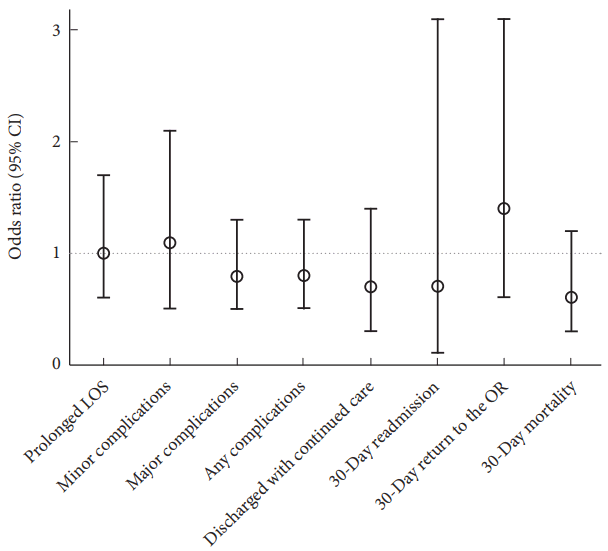
Fig. 4.
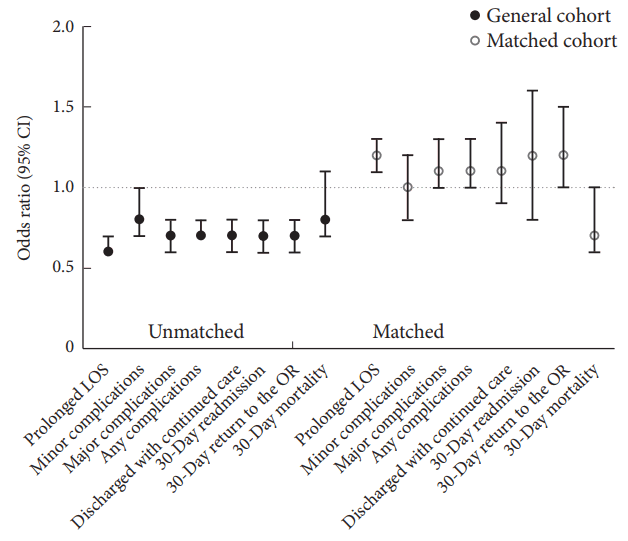
Table 1.
| Variable |
General cohort (n=33,977) |
Matched cohort (n = 20,340) |
||||
|---|---|---|---|---|---|---|
| Resident present | Attending alone | Absolute standardized difference | Resident present | Attending alone | Absolute standardized difference | |
| n=13,654 (40.2%) | n=20,323 (59.8%) | n = 10,170 (50%) | n = 10,170 (50%) | |||
| Age (yr), mean ± SD | 56 ± 15 | 57 ± 15 | 0.07 | 56 ± 14 | 57 ± 15 | 0.07 |
| Female sex | 49.2 | 48.7 | 0 | 47.4 | 49.0 | 0.03 |
| Caucasian | 77.1 | 78.7 | 0.04 | 78.0 | 77.6 | 0.01 |
| Admitted from home | 91.4 | 96.3 | 0.20b | 93.1 | 94.7 | 0.07 |
| Smoking status | ||||||
| Never | 61.4 | 63.3 | 0.13 | 60.4 | 63.9 | 0.12 |
| Current | 22.8 | 25.3 | 23.3 | 23.8 | ||
| Previous | 15.8 | 11.4 | 16.3 | 12.3 | ||
| > 2 Alcoholic drinks per day | 3.9 | 3.8 | 0 | 4.0 | 4.0 | 0 |
| Partially or fully dependent functional status | 9.7 | 7.5 | 0.08 | 9.2 | 9.4 | 0.01 |
| ASA PS classification | ||||||
| I & II | 42.6 | 53.0 | 0.21b | 45.7 | 47.5 | 0.04 |
| III & IV | 56.8 | 46.8 | 53.7 | 52.0 | ||
| Body mass index (kg/m2), mean ± SD | 29.2 ± 6.6 | 29.6 ± 6.6 | 0.07 | 29.3 ± 6.6 | 29.5 ± 6.7 | 0.03 |
| Diabetes mellitus | 13.0 | 15.1 | 0.06 | 13.8 | 15.7 | 0.05 |
| Cerebrovascular comorbidities | 4.1 | 3.6 | 0.03 | 3.5 | 3.9 | 0.02 |
| Cardiopulmonary comorbidities | 16.8 | 18.2 | 0.04 | 17.4 | 19.5 | 0.06 |
| Hypertension requiring medication | 44.6 | 47.9 | 0.07 | 46.5 | 48.6 | 0.04 |
| Renal comorbidities | 23.2 | 23.1 | 0 | 23.2 | 24.6 | 0.03 |
| Cancer comorbidities | 7.0 | 3.5 | 0.16 | 5.6 | 5.2 | 0.02 |
| Steroid use for chronic condition | 7.3 | 4.7 | 0.11 | 6.6 | 5.7 | 0.03 |
| Sepsis or SIRS | 4.4 | 2.0 | 0.14 | 4.0 | 2.7 | 0.08 |
| Prior operation within 30 days | 3.3 | 1.9 | 0.09 | 3.2 | 2.4 | 0.05 |
| Bleeding risk factors | 8.9 | 7.8 | 0.04 | 8.9 | 9.0 | 0 |
| Anemia | 20.8 | 18.1 | 0.07 | 28.7 | 27.7 | 0.06 |
| Abnormal LFT | 13.5 | 11.8 | 0.05 | 13.2 | 13.2 | 0 |
| Abnormal Na | 21.5 | 20.6 | 0.05 | 21.8 | 20.6 | 0.05 |
| Abnormal WBC count | 21.5 | 16.7 | 0.12 | 20.2 | 18.8 | 0.04 |
| Perioperative transfusion | 9.0 | 4.7 | 0.17 | 8.0 | 5.3 | 0.11 |
| Emergency | 7.5 | 5.1 | 0.10 | 7.1 | 6.9 | 0.01 |
| Cranial surgery | 41.0 | 15.7 | 0.59b | 28.2 | 28.3 | 0 |
| Number of procedures undergone | ||||||
| 1 | 51.7 | 62.4 | 0.25b | 58.2 | 58.2 | 0 |
| 2 | 19.1 | 12.7 | 15.8 | 15.8 | ||
| 3 | 10.2 | 6.9 | 7.1 | 7.1 | ||
| 4 | 5.3 | 5.9 | 5.4 | 5.4 | ||
| 5 | 4.6 | 4.3 | 4.7 | 4.7 | ||
| 6 | 3.8 | 3.3 | 3.8 | 3.8 | ||
| 7 | 2.4 | 2.0 | 2.3 | 2.3 | ||
| 8 | 1.5 | 1.4 | 1.6 | 1.6 | ||
| 9 | 1.1 | 0.7 | 0.8 | 0.8 | ||
| 10 | 0.4 | 0.4 | 0.3 | 0.3 | ||
| Multiple CPT codes | 48.4 | 37.6 | 0.22b | 41.8 | 41.8 | 0 |
| Length of surgery (min), mean ± SD | 198 ± 122 | 140 ± 96 | 0.53b | 181 ± 111 | 147 ± 100 | 0.32b |
Values are presented as percentage (%) unless otherwise indicated.
SD, standard deviation; ASA PS, American Association of Anesthesiologists physical status; SIRS, systemic inflammatory response syndrome; LFT, liver function test; Na, sodium; WBC, white blood cell; CPT, current procedural terminology; ICD-9, Ninth Revision of the International Classification of Diseases; OR, operating room.
Table 2.
| Outcome |
General cohort (n=33,977) |
Matched cohort (n = 20,340) |
||
|---|---|---|---|---|
| Resident present | Attending alone | Resident present | Attending alone | |
| n=13,654 (40.2%) | n=20,323 (59.8%) | n=10,170 (50%) | n=10,170 (50%) | |
| Total length of hospital stay (day), mean ± SD | 6 ± 10 | 4 ± 10 | 6 ± 10 | 5 ± 12 |
| Median | 3 | 2 | 3 | 3 |
| Prolonged LOS (> 4 days) | 34.6 | 21.9 | 30.3 | 27.5 |
| Minor postoperative complications | 5.0 | 3.5 | 4.8 | 4.2 |
| Superficial surgical site infection | 1.0 | 0.9 | 1.1 | 1.0 |
| Urinary tract infection | 2.6 | 1.8 | 2.4 | 2.2 |
| DVT or thrombophlebitis | 1.7 | 0.8 | 1.6 | 1.1 |
| Major postoperative complications | 11.8 | 6.9 | 10.2 | 8.7 |
| Deep incision surgical site infection | 0.7 | 0.5 | 0.7 | 0.4 |
| Organ or space surgical site infection | 0.7 | 0.3 | 0.6 | 0.3 |
| Wound disruption | 0.2 | 0.3 | 0.2 | 0.2 |
| Pneumonia | 2.1 | 1.1 | 1.8 | 1.5 |
| Unplanned intubation | 1.9 | 0.8 | 1.6 | 1.1 |
| > 48-Hour postoperative ventilator-assisted respiration | 3.8 | 1.6 | 2.9 | 2.5 |
| Pulmonary embolism | 0.8 | 0.5 | 0.7 | 0.7 |
| Renal insufficiency or failure | 0.3 | 0.2 | 0.3 | 0.2 |
| Cerebrovascular accident with neurological deficit | 1.2 | 0.4 | 0.6 | 0.7 |
| Coma of > 24 hours | 0.5 | 0.3 | 0.4 | 0.5 |
| Peripheral nerve injury | 0.2 | 0.1 | 0.1 | 0.2 |
| Cardiac arrest or MI | 0.6 | 0.4 | 0.6 | 0.5 |
| Graft, prosthesis, or flap failure | 0 | 0 | 0 | 0 |
| Sepsis or septic shock | 3.1 | 1.2 | 2.5 | 1.6 |
| Any infectionb | 4.8 | 2.6 | 4.2 | 3.0 |
| Any postoperative complicationc | 5.4 | 3.7 | 12.7 | 11.2 |
| Discharged with continued cared | 19.5 | 12.7 | 17.7 | 14.9 |
| 30-Day readmissiond | 7.3 | 5.5 | 6.5 | 5.8 |
| 30-Day return to the OR | 5.4 | 3.7 | 4.7 | 4.2 |
| 30-Day mortality | 2.1 | 1.3 | 2.0 | 2.1 |
SD, standard deviation; LOS, length of stay; DVT, deep venous thrombosis; MI, myocardial infarction; OR, operating room; ICD-9, Ninth Revision of the International Classification of Diseases.
a Propensity score consists of diagnostic and procedure codes, defined according to CPT and ICD-9 codes.
Table 3.
| Outcome | Logistic regression in the full study sampleb | Conditional logistic regression in the propensity score-matched samplec | Multivariate conditional logistic regression in the propensity score-matched sample, including length of surgeryc |
|---|---|---|---|
| Prolonged LOS | 1.9 (1.8–2.0)a | 1.2 (1.1–1.3)a | 1.0 (1.0–1.1) |
| Minor complications | 1.5 (1.3–1.7)a | 1.2 (1.0–1.3) | 1.1 (1.0–1.3) |
| Major complications | 1.8 (1.7–1.9)a | 1.2 (1.1–1.3)a | 1.1 (1.0–1.2) |
| Any infectionb | 1.9 (1.7–2.1)a | 1.4 (1.2–1.7)a | 1.3 (1.1–1.6)a |
| Any complications | 1.6 (1.5–1.8)a | 1.2 (1.1–1.3)a | 1.1 (1.0–1.2) |
| Discharged with continued cared | 1.7 (1.5–1.8)a | 1.1 (1.0–1.3) | 1.0 (0.9–1.2) |
| 30-Day readmissiond | 1.4 (1.2–1.6)a | 1.1 (0.8–1.4) | 1.0 (0.8–1.3) |
| 30-Day return to OR | 1.5 (1.3–1.6)a | 1.1 (1.0–1.3) | 1.0 (0.9–1.2) |
| 30-Day mortality | 1.6 (1.4–1.9)a | 0.9 (0.8–1.2) | 0.9 (0.8–1.2) |
Values are presented as odds ratio (95% confidence interval).
CPT, current procedural terminology; LOS, length of hospital stay; OR, operating room.
b Logistic regression in total sample described in Tables 1 and 2 (n resident present=13,654; n attending alone = 20,323).
c Conditional logistic regression in the propensity-score matched sample described in Table 1 (n resident present=10,170; n attending alone=10,170). Propensity score was determined based on primary CPT, number of procedures undergone, and all baseline characteristics significantly different between resident alone and attending alone in Table 1 except for time in the OR.
REFERENCES

- TOOLS
- Related articles in NS
-
Journal Impact Factor 3.2


