Intra- and Interrater Reliability of Sagittal Spinopelvic Parameters on Full-Spine Radiographs in Adults With Symptomatic Spinal Disorders
Article information

Abstract
Background/Aims
To evaluate the intra- and interrater reliability (I-IR) of sagittal spinopelvic parameters from digital full-spine plain radiographs with basic software tools in an unselected adult population with degenerative spinal complaints who were evaluated for surgery.
Methods
Forty-nine adult full-spine digital radiographs were measured twice by 3 independent observers, including an experienced spine surgeon, an experienced radiologist, and a resident orthopedic surgeon. Clinical picture archiving and communication system workstations and software tools were used and landmarks were set manually. The I-IR of the sagittal vertical axis (SVA), pelvic tilt (PT), pelvic incidence (PI), sacral slope (SS), and thoracic kyphosis in T4–T12 (TK) were assessed.
Results
The intrarater intraclass correlation coefficient (ICC) scores varied from 0.82 to 0.99. The interrater ICC scores ranged from 0.78 to 0.99. The intrarater standard error of measurement (SEM) values for SS, PT, PI, and TK varied from 0.8° to 5.0°, and the interrater SEM values ranged from 2.5° to 6.2°, depending on the parameter and the reading round. The I-IR SEM values for SVA varied from 2.2 to 5.7 mm and from 4.6 to 5.0 mm, respectively. Kappa values were >0.88 for all readers. The intrarater variability was the smallest for the most experienced rater.
Conclusion
The I-IR of measuring sagittal spinopelvic parameters on digital full-spine images with basic software tools was high. Parameters consisting of several anatomic landmarks were more liable to error. Rater experience had a positive influence on reliability and repeatability. Reader experience should be assessed before accepting measurements for surgical planning and the interpretation of surgical correction during postoperative follow-up.
INTRODUCTION
Coronal and sagittal radiographs are used to measure and classify curve severity and spinal imbalance, plan treatment, and monitor treatment efficacy [1-3] Multiple coronal, sagittal, and pelvic parameters for measuring spine structure that are salient in clinical decision-making have been described previously [4-6] The parameters chosen in this study are located at critical points for imaging quality [7]; they have the least intra- and interrater agreement according to previous studies (i.e., the repetitive measurements of thoracic kyphosis T4–T12 [TK] and pelvic incidence [PI] are the least reproducible compared to sacral slope [SS] and pelvic tilt [PT], and the repetitive measurement of sagittal vertical axis [SVA] has been highly reproducible). In contrast, measurements from radiographs in the lateral view have been less reproducible and reliable than those taken in the coronal view [8,9].
The majority of previous studies have focused on testing the reliability and repeatability of spinopelvic parameters in cases of adolescent scoliosis or adult deformities. The importance of sagittal balance and pelvic parameters in planning of surgery for degenerative thoracolumbar pathologies has been recognized [10-12]. In fact, measuring the radiographic spinopelvic parameters of sagittal balance and individual need of lumbar lordosis to prevent functional disability is now a routine part of many interventions for degenerative spinal diseases [13]. An increasing number of orthopaedic- and neurosurgeons, and deformity specialists worldwide use these measurements without specific planning tools or experience in planning of deformity surgery. However, only few institutions and surgeons have access to highly developed imaging such devices as EOS (EOS Imaging, Paris, France) and the radiographic surgery planning is still performed from plain radiographs with the provided manufacturer’s tools.
The present study aimed to evaluate the intra- and interrater reliability of measuring sagittal spinopelvic parameters from digital full spine plain radiographs with basic digital imaging tools in an unselected adult population with prolonged degenerative spinal conditions that was assessed for surgical treatment.
MATERIALS AND METHODS
1. Patients
After statistic power calculation (power 0.80, alpha level 0.05, acceptable ICC>0.75, and maximum loss of patients 5%) digital full spine radiographs in the anterior-posterior (AP) and lateral views were obtained during 4 months from 50 consecutive adult patients referred to our institution´s spine clinic because of any prolonged thoracolumbar spinal complaints. Full spine radiographs were taken as part of the routine examination for treating spine disorders. One patient with a complex idiopathic deformity and an inadequate radiograph was excluded. This study was approved by the local Research Ethics Committee (identification: 17U/2012). All enrolled patients provided written informed consent.
2. Measurements
Lateral view angular parameters, including TK, PT, PI, SS, and interval parameter SVA, were chosen to determine the accuracy of different modes of measurement (Fig. 1). The Scoliosis Research Society (SRS)-Schwab adult deformity classification [14] was used to classify the values for PT and SVA.
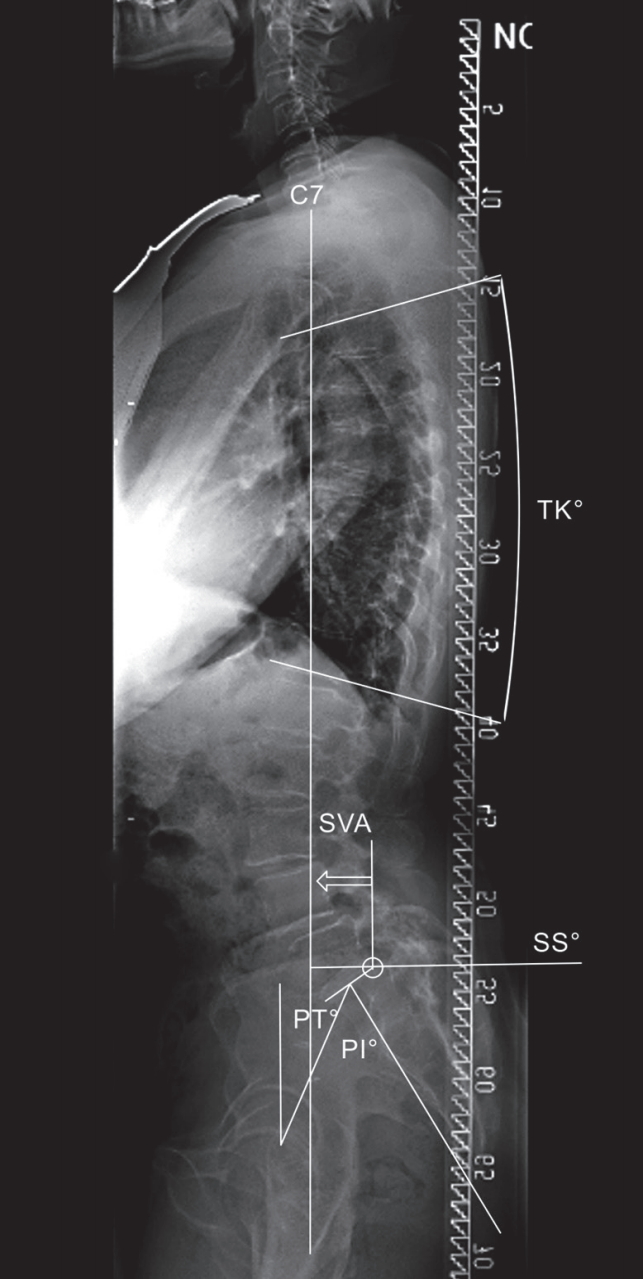
Spinopelvic parameters and the alignment control bar on lateral digital full spine radiography. SVA, sagittal vertical axis; PT, pelvic tilt; PI, pelvic incidence; TK, thoracic kyphosis; SS, sacral slope.
Images were interpreted in consecutive order of patient admission on the first round by 3 raters, including an experienced (10-year practice) spine surgeon (rater 1), an experienced (25-year practice) radiologist (rater 2), and a resident orthopaedic surgeon (3-year general and 1-year orthopaedic surgical practice) (rater 3). The second round of measurements was conducted 2 weeks later, and patients’ images were randomly arranged.
3. Imaging
A GE Discovery XR 650 device (General Electric Co., Milwaukee, WI, USA) was used for digital radiography. Full spine radiographs were acquired using GE’s Auto Image Paste application. Initially, 2–3 separate subexposures were taken depending on the patient’s height. Subimages were processed and aligned automatically into a single composite image using the overlapping anatomical content of the subimages. Every composite image was visually inspected by a radiographer, and misaligned images were realigned manually.
The source to image-receptor distance was 200 cm. Radiography tube filtration was equivalent to 2.8 mm of aluminium. An additional 0.2-mm-thick copper filtration was selected when using the automatic exposure with a 120-κVp tube voltage. Manual exposures were acquired by using 80 κVp on AP projections and 90 κVp on lateral projections. No additional filtration was used with manual exposures. The mA selection was based on patients’ diameter, constitution, and presumed bone density, according to a 4-class scale (lean, normal, large, or obese), in the imaging area size. The spine was placed as close to the detector as possible to diminish magnification bias. Distance measurements were based on imager pixel spacing, where all distance measurements were physical distances measured at the front plane of the detector housing. Patients were positioned in both views and they stood with their feet 10 cm apart, with knees and hips extended in the neutral position. In the lateral view, the shoulders were set passively to 30° flexion, and the hands were supported to avoid a negative shift and variability of sagittal balance [7,15].
The Workstation IDS7 (Sectra AB, Linköping, Sweden) picture archiving and communication system (PACS) software ver. 14.3 was used to perform the measurements from digital images. The SVA and TK were measured from the full spine image, and pelvic parameters were measured from the caudal subimage. Routine clinical hardware and software tools for image enhancement were available.
4. Statistical Analyses
Intraclass correlation coefficients (ICC) were used to examine the intra- and interrater reliability. Coefficients with 95% confidence intervals (CIs) were determined using 1-way random single measurement for intrarater analysis and a 2-way mixed model with absolute agreement for interrater analysis [16]. The reliability was regarded as acceptable if the ICC was >0.75 [17]. The standard error of measurement (SEM) was used as a parameter of absolute reliability and agreement. In the intrarater analysis, i.e., 1-way analysis of variance (ANOVA) with the patient as a random factor, the SEM was calculated as the square root of residual variance. The CIs for the SEM were obtained by using the degrees of freedom associated with estimated residual variance and the percentage points from corresponding chi-square distribution analysis [18]. For interrater analysis, the SEM was defined as the square root of the sum of residual and rater variances to consider any systematic differences between theraters [19]. CIs were calculated from the asymptotic covariance matrix of variance components obtained by using the restricted maximum likelihood method and the general Satterthwaite approximation for the degrees of freedom [18].
The coefficient of repeatability (CR) and the smallest detectable change (SDC) were obtained by multiplying the corresponding SEM by 1.96 and the square root of 2, respectively. The SDC is the minimum difference between 2 readings, which must be exceeded to demonstrate a true significant change.
Kappa and Fleiss-κ coefficients with bootstrapped 95% CIs were also calculated for classified measures. Kappa values were defined as follows: slight, 0.00–0.20; fair, 0.21–0.40; moderate, 0.41–0.60; substantial, 0.61–0.80; and almost perfect alignment, 0.8–1.00 [20]. A paired sample t-test was performed for intrarater analysis to detect possible systematic bias. For interrater analysis, ANOVA for repeated measurements using Scheffe correction for pairwise comparisons was adapted to determine systematic differences between raters.
RESULTS
The final cohort consisted of 49 patients (mean age, 54 years; range, 18–87 years; 17 men and 32 women) in 3 diagnostic groups: thoracolumbar back pain without nerve root compression (n=27, 55%), symptomatic nerve root compression (n=14, 29%), and spine structural deformities (scoliosis, kyphosis, spondylolysis, and olisthesis; n=8, 16%). Two patients had undergone previous instrumented surgery in the lower back area. The mean body mass index was 27.5 kg/m2 (range, 20–36 kg/m2). The mean Oswestry disability index was 35 (range, 6–80). Absolute and classified results of the image readings of the 3 raters are presented in Table 1.

Reading results of the spinopelvic parameters
According to the paired sample t-test, differences between both readings were not statistically significant, indicating that there was no systematic bias. For SS, PT, PI, and TK, the ICC scores varied by 0.82–0.99, whereas the SEM values varied by 0.8°–4.9°. For the SVA, the SEM varied by 2.2–5.8 mm. The CR of 6° indicated that rater 1’s SEM measurements were systematically lower than those of the other raters (Table 2).
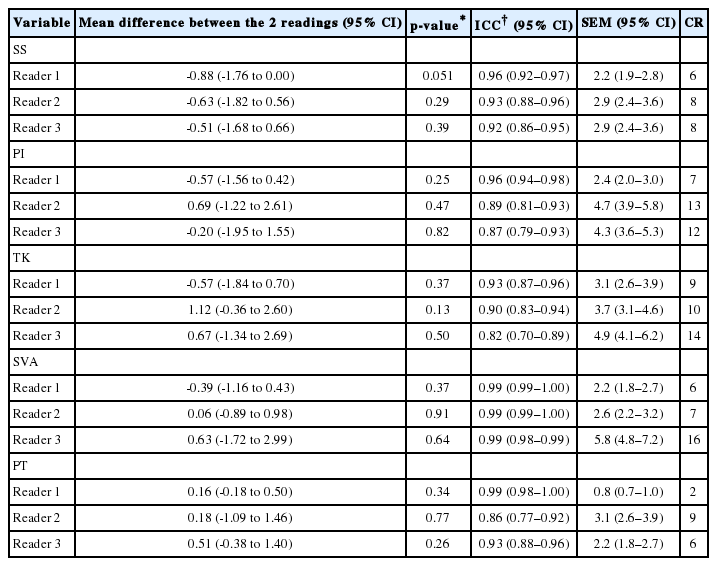
The intrarater agreement
Rater 1 categorized both SVA and PT into the same SRS-Schwab class on both readings (κ=1). For SVA and PT, rater 2 had κ values of 1 and 0.89 (95% CI, 0.71–0.96), respectively, and rater 3 had κ values of 0.88 (95% CI, 0.72–1.00) and 0.89 (95% CI, 0.75–0.97), respectively.
When comparing results between the raters, there were some systematic biases in angular measurements (p<0.05); for rater 1, the measured absolute angles were systematically higher compared with those of the other raters. The maximum mean difference in angular measurements between the raters varied from 2° to 5° for reading 1 and from 1° to 4° for reading 2.
Interrater ICC scores varied from 0.78 to 0.99 (Table 3). The SEM values varied from 2.5° to 6.2° for SS, PT, PI, and TK depending on the measured angle, and the reading round. For SVA, the SEM was ~5 mm. The SDC varied from 7° to 17° for all measured angles and was ~13 mm for SVA.
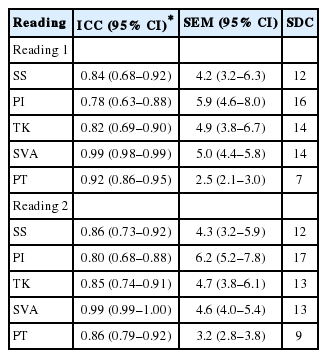
The interrater agreement
Fleiss-κ values (95% CI) among the 3 raters for the classified parameters were as follows: SVA reading 1, 0.94 (0.80–1.00); SVA reading 2, 0.97 (0.86–1.00); PT reading 1, 0.83 (0.70–0.93); and PT reading 2, 0.81 (0.68–0.91). For SVA, the raters assigned the same classification grade in 96% and 98% of the cases for the first and second reading rounds, respectively. For the PT, the corresponding figures were 86% and 84%, respectively.
DISCUSSION
Data from this adult population with prolonged spinal complaints showed a high intra- and interrater reliability of pelvic parameters for individual ICC values. The SEM values showed acceptable variation.
All raters obtained high intrarater ICC values (>0.75), and almost all intrarater ICCs were better than the interrater ICCs. Our ICC findings were similar to those reported by Aubin et al. [9] who used new semiautomatic measurement software in which anatomic landmarks are automatically generated but can be modified manually. Their study also included 3 raters with varying levels of experience, and they reported that the reliability and accuracy of measurements was dependent on the rater’s experience. Kim et al. [21] compared 2 radiographic methods used in daily practice: film and digital radiographs. Landmarks were identified manually on film, but the PACS tool was used for digital radiographs. They showed that ICC values were highest with an experienced rater and the computerized calculation method. In contrast, variability between 2 measurements was highest when the rater was less experienced and manual measurements were made. Kim et al. [21] had a population similar to ours, except that grade ≥2 spondylolisthesis was excluded because it was difficult to measure. In our study, a single case with a postoperative severe deformity was excluded because of the loss of most anatomic landmarks. Vila-Casademunt et al. [22] reported ICC values >0.85 for PI, PT, and SS in patients with lumbopelvic instrumentation. They evaluated 13 raters with different experience levels, and they concluded that inexperienced surgeons can measure sagittal pelvic parameters after a short tutorial by using a semiautomatic computerized method (Surgimap Spine, Nemaris Inc., New York, NY, USA). In addition, Lafage et al. [23] recently published even better reproducibility values with an updated measuring software, and they concluded that enhanced image quality and new software eliminate differences in the rater’s experience.
The exact method for calculating ICC values has not always been reported in previous publications, which makes comparing ICC measurements between different populations difficult, and prevents the generalization of findings to a wider range of patients.
Our sample included patients with a wide range of morphologies and ages, and 2 patients who had undergone lower back fusion surgery. The magnitude of interpatient variation may have influenced the high interrater ICC values. Thus, ICC values demonstrating a narrow range appeared to be higher when applied to our group. In addition to the ICC values, it is important to calculate SEM values and express variation in the actual units of measurements. The smaller the SEM value, the better the agreement.
In our study, the SEM values showed some variation, but the intrarater variability of the SEM was the smallest with the most experienced reader. Vila-Casademunt et al. [22] found interrater SEM values of 4.4° for PI, 2.2° for PT, and 4.2° for SS, which were similar to our findings of 5.9°–6.2°, 2.5°–3.2°, and 4.2°–4.3°, respectively. Moreover, in a previous study by Aubin et al. [9] the interrater standard deviation units were similar, and in the study fo Lafage et al. [23] the International Organization for Standardization reproducibility was slightly better than the SEM interrater measurements in our study. Both of these authors concluded that semiautomatic measurement tools offer advantages over manual digital measurements.
In our study, rater 1 had the smallest CR values for all the measurement categories. For rater 1, the CR results for SVA indicated that if the difference in the measurement between the 2 reading periods was >6 mm, then a true change can be assumed to have happened. In contrast, rater 3 had the largest CR values (CR=16). This finding is important in evaluating postoperative radiographs and results of surgical correction during long follow-up, when other readers than the experienced operating surgeon analyze the radiographs. In our study, the angular measurements that were most difficult to perform appeared to be those of PI and TK, which was congruent with the findings of Aubin et al. [9], Yamada et al. [24] analyzed the problem of angular measurements to be the difficulty in precisely identifying the sacral endplate. The SDC values for all parameters were higher if the rater was less experienced. Our findings indicated that for complex measurements such as PT and PI, small changes were not detected by less experienced raters during follow-up imaging, which could have a significant effect on preoperative planning.
For both angular and distance classified parameter measures, the κ values were excellent in our study. In an SRS-Schwab adult deformity validation study [14], 9 raters, authors, and members of the SRS Adult Deformity Classification Committee measured and classified PT and SVA. Their mean κ values for intrarater reliability were 0.85–1.00 for PT and 0.77–1.00 for SVA, which were comparable with our findings, regardless of the lower experience of the 2 raters in our study. We suggest that when planning deformity surgery, angles and lengths should be registered, and the deformity class for the threshold values should be considered.
Measurement bias is dependent on extra- and intrameasurement factors. For example, rotation of the pelvis on images produces a landmark bias, and measuring pelvic parameters is not reliable if the pelvis is rotated >30° [25]. A patient’s physical stature, obesity, degeneration, osteoporosis, and superimposition of the shoulders can all cause inaccuracy in determining anatomic measurement points. Such errors can accumulate when a parameter requires the identification of several anatomic structures. An advantage of using image-processing software is improved identification of landmarks through the application of image enhancement tools. However, the reliability of the measurement still depends on rater experience [9,22], as we found in our study.
This study had limitations, including a small sample size, very few severe coronal deformities and that only specific and potentially clinically relevant radiological sagittal parameters were selected. However, since the present sample accurately represented the heterogeneity of patients and image qualities seen in daily clinical practice, the results can be more easily generalized. In the future, more developed spine-specific calculation and planning tools may be integrated to baseline software eliminating the need for separate software, and better reliability measures could be achieved in a repeated study. Also, the impact of severe coronal deformity on repeatability of the measurement of the sagittal parameters is important to study with a deformity patient subgroup.
CONCLUSION
We conclude that in our study, the intra- and interrater reliability of measuring sagittal spinopelvic parameters from digital full spine images with routinely available software tools in an unselected adult population with degenerative spine disorders was high. However, parameters that required the identification of several anatomic landmarks were more liable to measurement errors, and the rater’s experience had a positive influence on the reliability and repeatability of measurements. Our study reflects the need for thorough education and training and reliability and repeatability testing of image raters prior to implementing their spinopelvic measurements in clinical practice.
Notes
The authors have nothing to disclose.
Acknowledgements
This study was supported by the Medical Research Foundation of Central Hospital of Central Finland and the Eastern Finland University, Kuopio, Finland.