Impact of Surgical Timing on Neurological Outcomes for Spinal Arachnoid Cyst: A Single Institution Series
Article information

Abstract
Objective
Spinal arachnoid cysts (SACs) are rare lesions that often present with back pain and myelopathy. There is a paucity of literature evaluating the impact of surgical timing on neurological outcomes for primary SAC management. To compare long-term neurological outcomes in patients who were managed differently and to understand natural progression of SAC.
Methods
We conducted a retrospective analysis of adult patients treated for SAC at our institution from 2010 to 2021, stratified into 3 groups (conservative management only, surgical management, or conservative followed by surgical management). Study outcome measures were neurological outcomes as measured by modified McCormick Neurologic Scale (MNS), postoperative complications, and cyst recurrence. Nonparametric analysis was performed to evaluate differences between groups for selected endpoints.
Results
Thirty-six patients with SAC were identified. Eighteen patients were managed surgically. The remaining 18 patients were managed conservatively with outpatient serial imaging, 7 of whom (38.9%) ultimately underwent surgical treatment due to neurological decline. Most common presenting symptoms included back pain (50.0%), extremity weakness (36.1%), and numbness/paresthesia (36.1%). Initial/preoperative (p = 0.017) and 1-year postoperative (p = 0.006) MNS were significantly different between the 3 groups, but not at 6 weeks or 6 months postoperatively (p > 0.05). Additionally, at 1 year, there was no difference in MNS between patients managed surgically and those managed conservatively but ultimately underwent surgery (p > 0.99).
Conclusion
Delayed surgical intervention in minimally symptomatic patients does not seem to result in worse long-term neurofunctional outcomes. At 1 year, postoperative MNS were significantly higher in both surgical groups, when compared to the conservative group highlighting worsening clinical picture regardless of preoperative observational status.
INTRODUCTION
Spinal arachnoid cysts (SACs) are rare lesions that often present with back pain and myelopathy [1-4]. The majority of these cysts are thoracic in nature and are more common in men with a peak incidence in the second decade of life [1-3,5,6]. SAC are classified into 3 subtypes. Type 1 cysts are extradural (EACs) without nerve root involvement, type 2 cysts are EACs with nerve root involvement, and type III cysts are intradural meningeal cysts [7]. While the etiology of SAC is unclear, they are generally thought to arise due to congenital defects such as vertebral anomalies, neural tube defects, and syringomyelia [5]. Secondary causes of cyst formation such as infection, trauma and surgical procedures including lumbar myelography and laminectomy have been reported, but are less common [1,2,5,8-10]. The mechanism of cyst formation is poorly understood and multiple theories have been proposed including osmotic gradients resulting in fluid shifts, and active fluid secretion from the cyst itself [3,5]. Additionally, inflammatory adhesions of the arachnoid layer are known to form arachnoid webs [11]. Such arachnoid granulations have been postulated to create a one-way valve mechanism entrapping circulating cerebrospinal fluid (CSF), ultimately leading to the formation of SAC [12,13].
The current dogma for management of SAC is to treat symptomatic patients with surgery and to use observational management for asymptomatic patients or those with minimal symptoms [1,2,4,5]. Surgical management includes exploration and decompression through cyst excision, marsupialization, fenestration, shunting or a combination of these techniques [2,4,14]. Whether an observational method of treatment is the optimal therapy or potentially harmful for minimally symptomatic cases remains unknown as the natural progression of this rare pathology is understudied. Moreover, there is a paucity of literature pertaining to the long-term outcomes of patients who are managed conservatively first, but ultimately undergo surgery following neurological decline. It is unclear whether this group benefits from a period of surveillance and whether their long-term neurological outcome is different when compared to patients who undergo surgery at symptom presentation. The aim of this study is to compare long-term neurological outcomes in patients with SAC who were managed both conservatively and surgically, including a subset of patients who were managed conservatively first but ultimately underwent surgery secondary to neurological demise. This case series aims bring a better understanding of the natural course of SAC with a focus on long-term neurological outcomes.
MATERIALS AND METHODS
1. Study Design/Eligibility Criteria
We conducted a single-institution retrospective review of all adult patients (>18 years) with SAC over a 10-year period from January 2010 to August 2020. Data was collected via medical record review. Formal radiological reports were individually reviewed by 3 study authors (KS, SS, RW) and all patients with other cystic disorders of the spine including syrinx and hydromyelia were excluded. Demographics variables and clinical presentation including presenting symptoms, examination findings, and duration of symptoms were extracted. Patients were stratified into 3 groups based on their treatment: conservative management only (i.e., “conservative-only”), surgery at presentation (i.e., “initial-surgery”), and conservative management followed by surgery due to symptomatic progression (i.e., “conservative+surgery”) (Fig. 1). For patients who underwent surgical management, operative reports were reviewed to confirm surgical technique and other relevant intraoperative findings. Histopathologic reports of resected tissue were also evaluated to confirm SAC diagnosis. The study was evaluated by the independent Colorado Multiple Institutional Review Board (IRB) and found to be exempt from IRB review (No. 20-2783). Patient consent was not required.
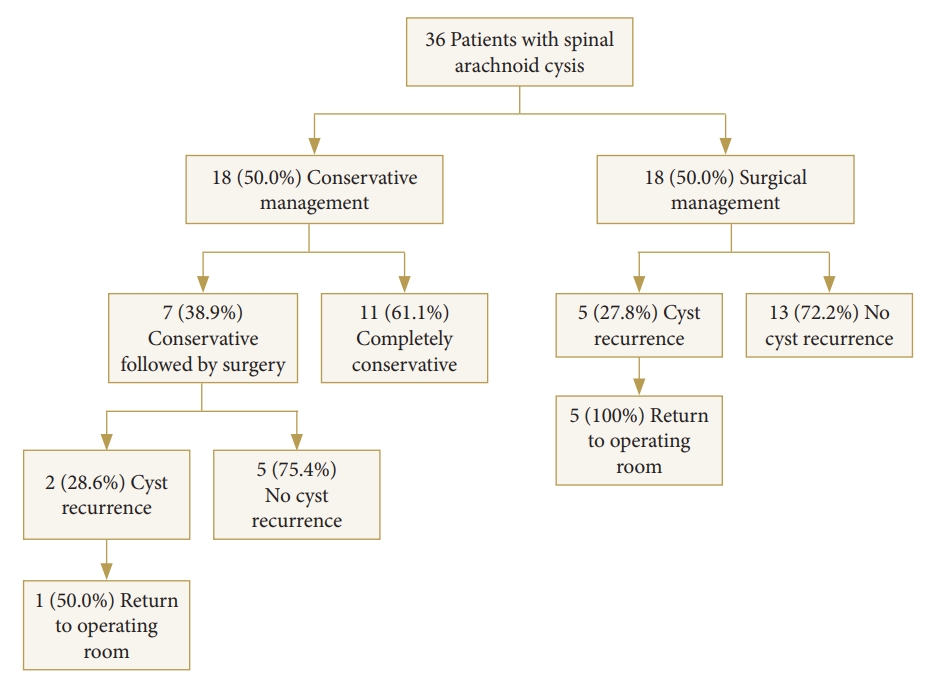
Flow diagram illustrating the different treatment avenues for patients with spinal arachnoid cysts. Rates of cyst recurrence and return to the operating room are included.
2. Surgical Protocol
Surgical candidacy in both the conservative and nonconservative cohorts were determined by both imaging findings and severity of clinical symptoms at the discretion of the attending neurosurgeon (Fig. 2). In all surgical cases, the cyst was exposed via a posterior approach using laminectomies spanning the length of the lesion and tailored to patient’s individual anatomy. For intradural cysts, ultrasound (US) imaging was used in most patients prior to the durotomy. Midline dural openings were performed followed by tack-up sutures to achieve satisfactory exposure (Fig. 3A). The cyst wall was carefully dissected away from the surrounding dura and spinal cord using blunt dissection (Fig. 3B). In most cases, the cyst wall was thickened and milky white allowing for clear identification. Meticulous surgical technique ensured that the cyst was visualized in its entirety. Patients either underwent complete cyst resection when able, marsupialization and/or fenestration at time of operation. In cases of extradural cysts, surgical exploration for a transdural conduit connecting the cyst and the subarachnoid space was carried out. When such communication was identified, it was ligated intraoperatively. Tissue specimens obtained from surgery were formalin fixed and stained with hematoxylin and eosin for pathological analysis.
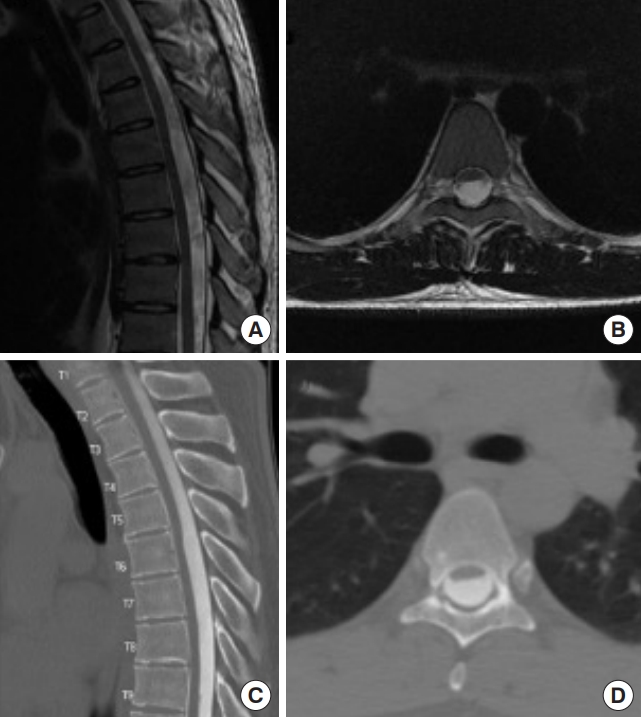
Case of a 26-year-old male who presented with a 2-year history of midback pain with no other symptoms. Sagittal (A) and axial (B) T2-weighted magnetic resonance images demonstrate ventral displacements of thoracic spinal cord. Sagittal (C) and axial (D) images of computed tomography myelogram revealed flattening of spinal cord greatest at the T6 level. Surgical exploration revealed intradural dorsal arachnoid cyst which was resected.

Intraoperative pictures showing surgical exploration of intradural arachnoid cyst. (A) A midline dural opening followed by tack-up sutures were performed to achieve satisfactory exposure. In most cases, the cyst wall is thickened and is milky white allowing it clear identification. (B) Cyst wall is then carefully dissected away from the surrounding dura and spinal cord using blunt dissection. Meticulous surgical technique ensures that the cyst is visualized in its entirety
3. Outcomes
The primary endpoint was neurologic functional status as determined by the modified McCormick Neurologic Scale (MNS) postoperatively at 6-week, 6-month, and 1-year. MNS values were independently confirmed by 2 authors (KS, SS) who were blinded to preoperative MNS. MNS was analyzed as a discrete variable counted 1–5 and, categorically with a value of 3 (neurofunctional independence) as the cutoff point for qualitative comparisons. Additionally, classification of treatment strategies (conservative management only, initial surgical treatment, and conservative followed by surgery), cyst recurrence, and the use of preoperative imaging and intraoperative US were also of particular interest.
4. Statistical Analysis
Data analysis and storage were performed using GraphPad Prism 9 (GraphPad Software, San Diego, CA, USA). Descriptive data are reported as simple means or proportions with standard deviations where applicable. For categorical variables, contingency tables were constructed and then analyzed using the chi-square test or Fisher exact test for counts less than 5. To query the difference in MNS between the 3 groups (conservativeonly, initial-surgery, and conservative followed by surgery,), a nonparametric one-way analysis of variance on ranks Kruskal-Wallis test was conducted at initial/preoperative evaluation and at 6 weeks, 6 months and 1 year postoperatively along with Dunn multiple comparisons. Three- and 5-year data were too scarce for adequate comparison. A p-value of 0.05 determined significance.
RESULTS
1. Cohort Demographics and Characteristics
In total, 36 patients with SAC were identified. The average age at diagnosis was 49.4 ± 16.7 years (range, 22–81 years) and 20 (55.6%) were female and 16 (44.4%) were male (Table 1). Most cysts were thoracic (61.1%) followed by lumbar (13.9%), sacral (8.3%), cervical (5.6%), thoracolumbar (5.6%), and lumbar-sacral (5.6%) in nature (Fig. 4). Eighteen patients (50.0%) were managed surgically (initial-surgery) whilst the remaining 18 patients (50.0%) were managed conservatively with serial imaging and outpatient follow-up. Seven patients (38.9%) in the conservative group eventually underwent surgery secondary to neurological decline (conservative+surgery group) (Fig. 1) with an average preoperative observational period of 38.04 months (range, 2.17–171.57 months) (Table 1).

Patient demographics between groups included in this series

Spinal arachnoid cyst distribution by predominant spinal level. Thoracic was the most common spinal arachnoid cyst level followed by lumbar, sacral, cervical/thoracolumbar, and lumbar-sacral. *In patients with cysts which spanned multiple levels, spinal level predominance was determined by the number of vertebral levels involved. If patients had cysts that equally involved 2 levels, they were classified as either thoracolumbar or lumbar-sacral predominant.
The most common initial symptoms in both cohorts included back pain (50.0%), extremity weakness (36.1%), extremity numbness (36.1%), and extremity pain (33.4%). Less common symptoms included bladder and bowel dysfunction (22.2% and 8.4%, respectively), allodynia (11.1%), difficulties with coordination (8.4%), and truncal numbness (5.6%). Duration of symptoms varied between cohorts with the conservative group having the greatest symptom duration (55.0 ± 27.6 months), followed by the conservative followed by surgery group (38.0 ± 56.3 months), and surgical group (13.6 ± 23.6 months) (Table 1).
Twenty-nine patients (80.6%) had intradural cysts. Seven patients (19.4%) had extradural cysts, 5 of which were managed completely conservatively and diagnosed via imaging. Two patients with extradural cysts were managed surgically and were found to have transdural conduits connecting the cyst to the subarachnoid space intraoperatively (Table 1).
2. Neurological Outcomes
Mean preoperative/initial examination MNS was highest for the initial-surgery group (2.67 ± 1.03), followed by the conservative+surgery (2.14 ± 0.38) and the conservative-only (1.60 ± 0.70) groups, which was significantly different on analysis of variance (p = 0.017) (Fig. 5A). For multiple comparisons, mean preoperative/initial MNS was significantly lower in the conservative-only group compared to the initial-surgery group (p = 0.01). No significant differences in preoperative/initial MNS were found between the conservative-only and conservative+surgery groups (p = 0.50) or between the initial-surgery and conservative+surgery groups (p = 0.94).
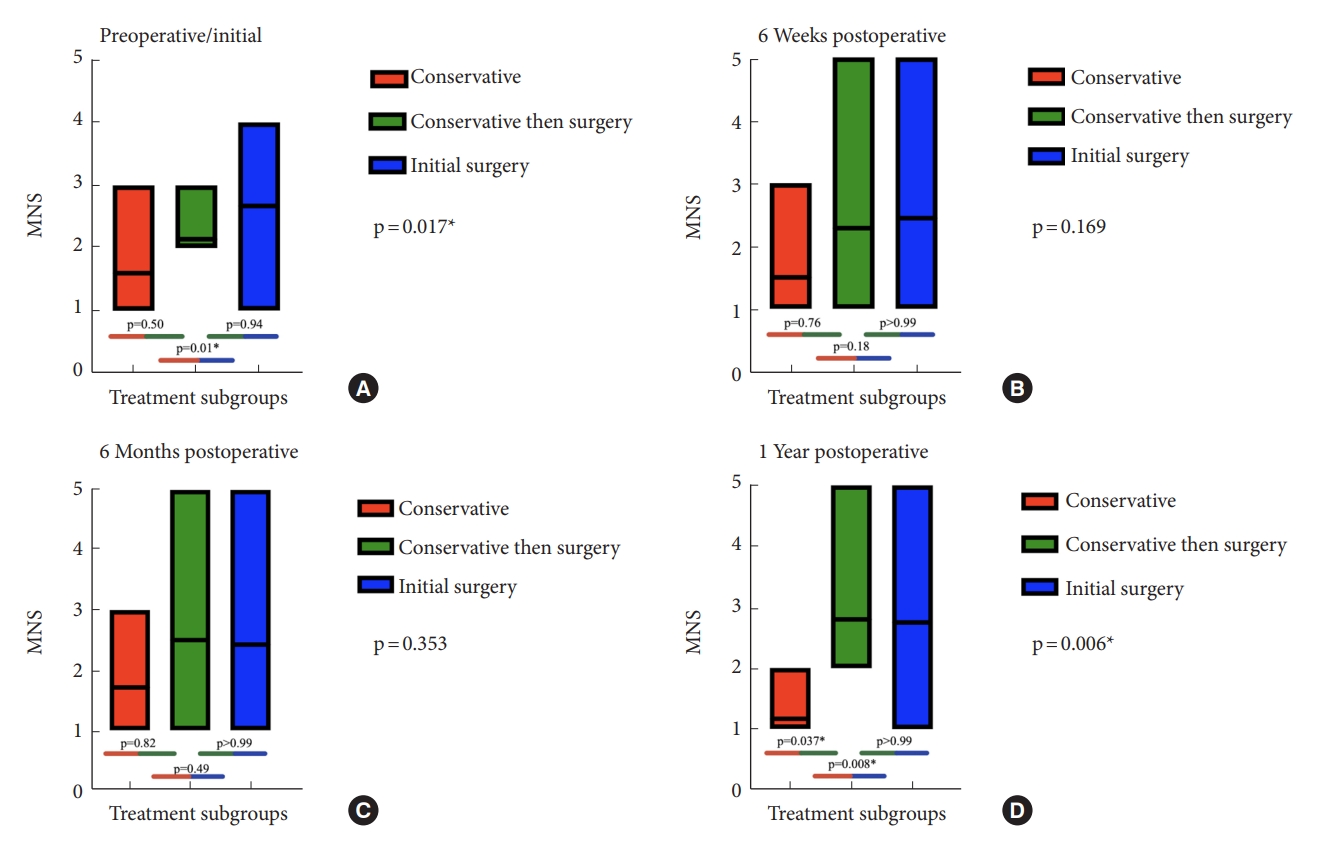
Box plot showing average preoperative/initial and postoperative McCormick Neurologic Scale (MNS) scores at 6 weeks, 6 months, and 1 year. Red color represents the group of patients who were managed solely conservatively. The green represents the group of patients who were initially managed conservatively but who ultimately underwent surgical management secondary to neurological decline. The blue represents the group of patients who underwent surgery at symptoms presentation. *p < 0.05, statistically significant differences.
At 6 weeks postoperatively, mean MNS was 1.50 ± 0.84 for the conservative-only group, 2.29 ± 1.50 for the conservative+ surgery group, and 2.44 ± 1.10 for the initial-surgery group, which was not significant on analysis of variance between the 3 groups (p = 0.17) (Fig. 5B). When looking at multiple comparisons, no significant differences in MNS were found between the conservative-only and initial-surgery groups (p = 0.18) suggesting improvement in neurological status. Similarly, no differences were noted between the conservative-only and conservative+surgery groups (p = 0.76) or when comparing patients in the surgery versus the conservative+surgery groups (p > 0.99).
At 6 months postoperatively, mean MNS was 1.71 ± 0.95 for the conservative-only group, 2.50 ± 1.52 for the conservative+surgery group, and 2.43 ± 1.09 for the initial-surgery group, which was not significant on analysis of variance between the 3 groups (p = 0.35) (Fig. 5C). For multiple comparisons, there were no significant differences in MNS found between the conservative-only and initial-surgery groups (p = 0.49). Likewise, no significant differences were found between the conservative-only and conservative + surgery groups (p = 0.82) or when comparing the initial-surgery and the conservative + surgery groups (p > 0.99).
At 1 year postoperatively, mean MNS was 1.17 ± 0.41 for the conservative-only group, 2.80 ± 1.30 for the conservative+sur gery group, and 2.75 ± 1.14 for the initial-surgery group, which was significantly different on analysis of variance between the 3 groups (p = 0.006) (Fig. 5D). Significant differences for multiple comparisons were observed in postoperative MNS scores when comparing both the conservative-only and initial-surgery groups (p = 0.008) and conservative-only and conservative+surgery groups (p = 0.037) indicating worsening neurological outcome. No significant differences were observed between the initial-surgery and conservative+surgery groups (p > 0.99).
3. Imaging Modalities
Preoperative computed tomography (CT) myelogram was obtained in 13 of 25 patients (52.0%), 7 of whom also had an MRI performed. Postoperative cyst recurrence rates were not significantly different in patients who underwent preoperative MRI alone versus MRI+CT myelogram (p > 0.99). Similarly, the use of intraoperative US did not significantly decrease postoperative cyst recurrence rates (p = 0.73).
4. Surgical Treatment
Out of the 25 patients who underwent surgical intervention, 12 were treated with complete cyst resection and 13 were treated with fenestration, marsupialization, or shunting. Rates of cyst recurrence were similar between these 2 surgical groups (p = 0.57).
5. Postoperative Complications
Of 38 surgeries completed for 25 patients, complications ranged from spinal cord tethering (10.5%), postoperative infection (7.9%), CSF leak (7.9%), new or worsening neurological deficit (7.9%), and arachnoiditis (5.3%). In the initial-surgery cohort, 5 patients (27.78%) experienced cyst recurrence and returned to the operating room (OR) for further management of their arachnoid cysts (mean return to OR lead-time of 455.5 days). One patient returned to the OR 5 times due to multiple episodes of cyst recurrence. In the conservative followed by surgery cohort, 2 patients (28.6%) experienced cyst recurrence; 1 patient (50.0%) returned to the OR 5 separate times for cyst recurrence (mean return to OR lead-time of 230.2 days) (Fig. 1).
DISCUSSION
1. Treatment and Long-term Neurological Outcomes
Management of SACs is challenging as their natural history and pathophysiologic progression remains unclear. Although there are no guidelines for SAC treatment, it is accepted that if a patient develops neurological symptoms due to spinal cord compression, surgical intervention is most likely necessary. A comprehensive summary of the current literature is provided (Table 2). As anticipated, patients in the conservative group had significantly lower MNS scores when compared to patients who underwent surgery at presentation (Fig. 5A). This was not the case for the conservative+surgery groups as their initial/preoperative MNS scores were similar to the conservative group (Fig. 5A).
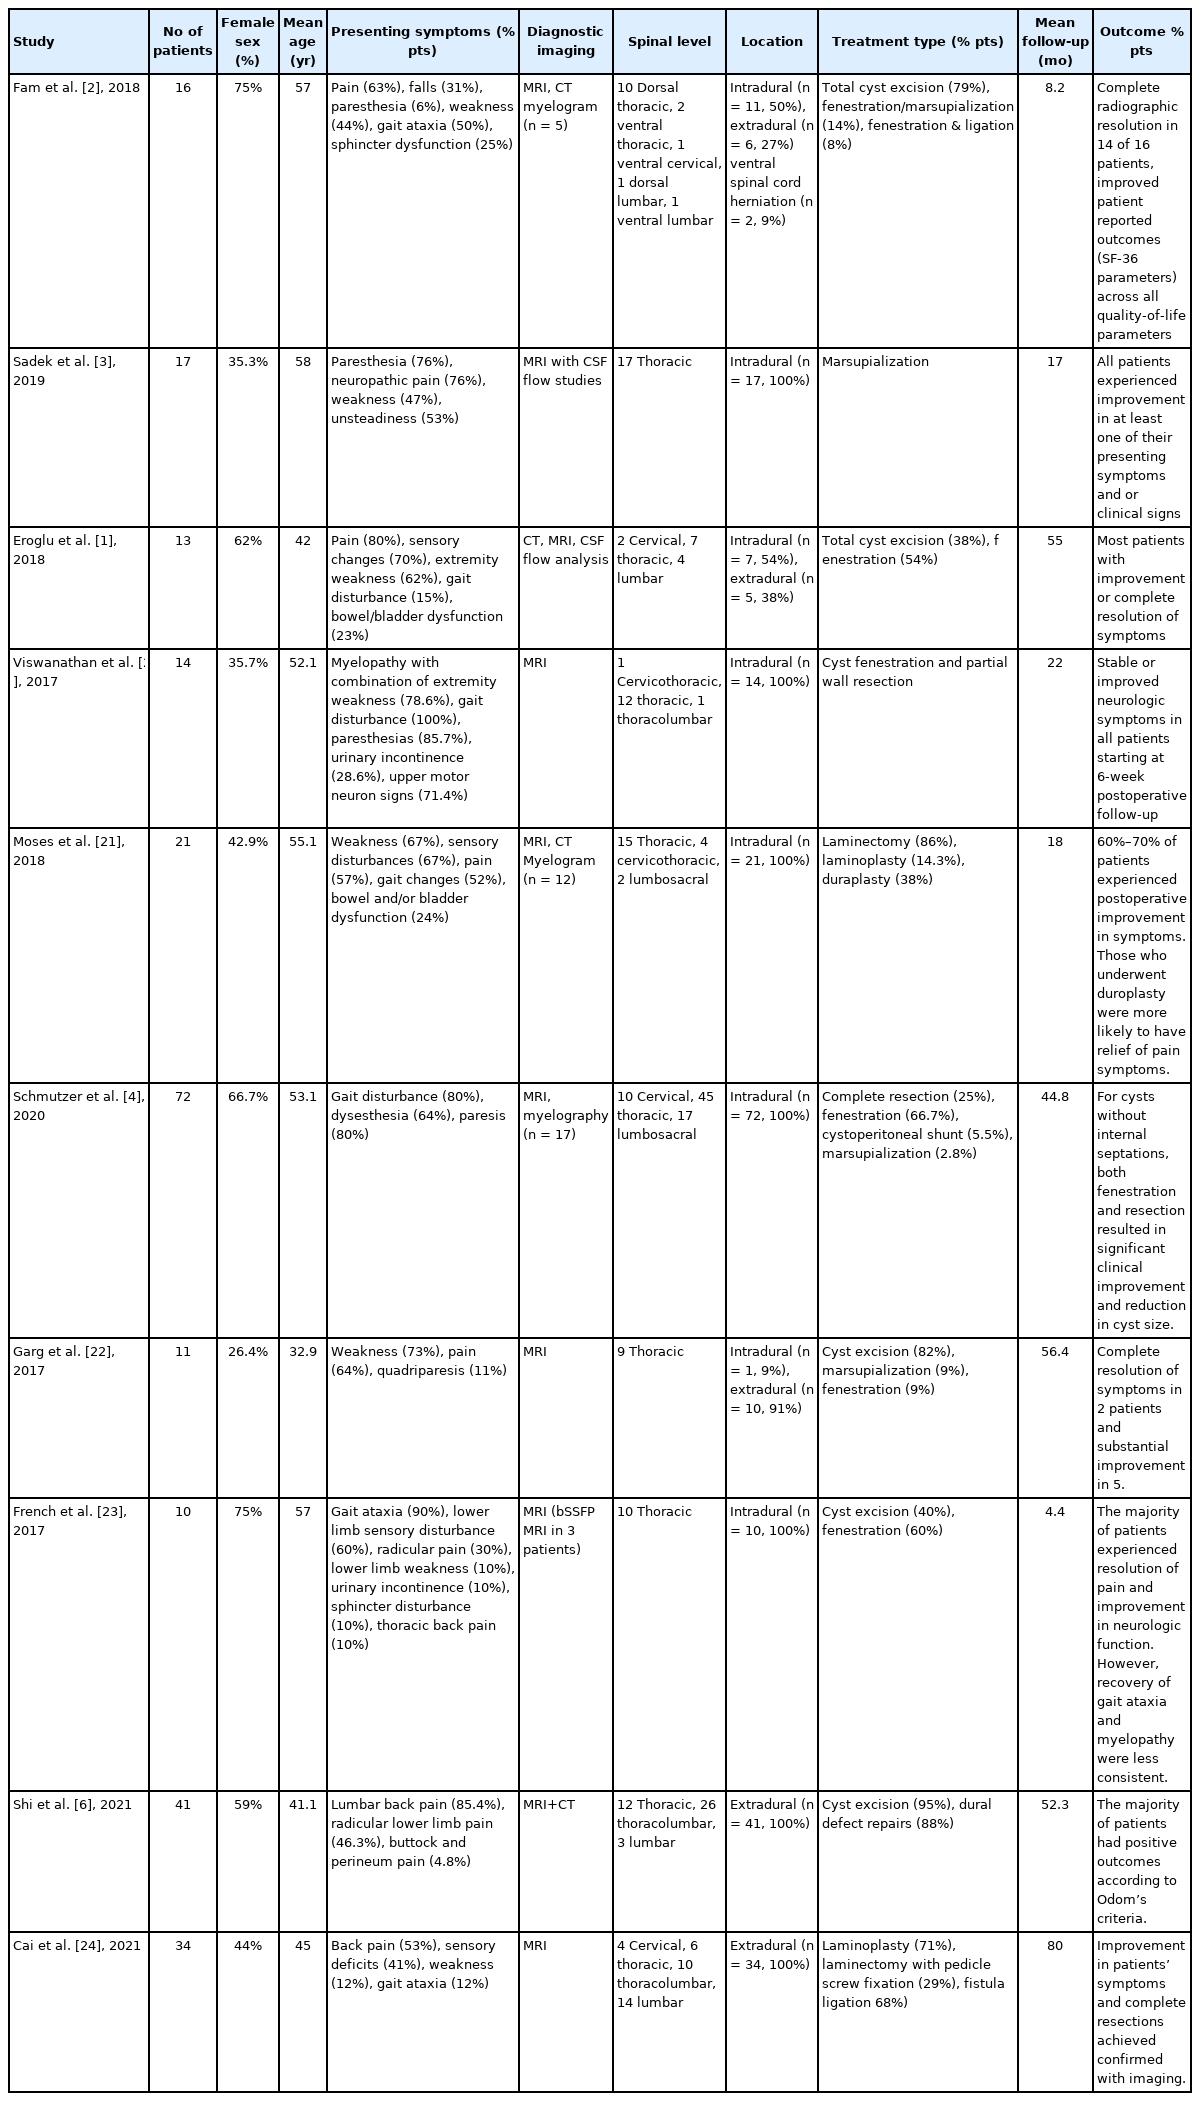
Results of literature review
It is hypothesized that postoperative functional outcomes often depend on multiple factors such as preoperative neurological status, cyst size, and duration of symptoms [15]. Because of these factors, the potential benefits of surgical intervention must be weighed against the possibility of poor surgical outcomes and potential for complications. Interestingly, nearly 40% of patients who were initially managed conservatively ultimately underwent surgical intervention secondary to neurological decline. For patients who present with minimal symptoms and radiographical evidence of arachnoid cyst, it remains debatable whether a period of observation can be theoretically harmful if the SAC were to enlarge and/or patient’s symptoms worsen significantly. When assessing their long-term neurological outcomes, at one year, there was no difference in McCormick scores between patients who were managed surgically and those who were initially managed conservatively and then ultimately underwent surgery (Fig. 5D). Based on this data, it does not seem that delayed surgical intervention in minimally symptomatic patients results in worse neurofunctional outcomes compared to patients who are initially treated surgically (Fig. 5B–D). Even-though a large proportion of our patients who were managed observationally eventually underwent surgical intervention with an average preoperative observational period of 38.04 months, it seems that an initial observation period for patients who are clinically stable remains beneficial. Specifically, if a patient has minimal symptoms or symptoms that are unlikely to be relieved by surgical intervention, conservative management of the arachnoid cyst in the form of serial imaging and monitoring of symptom progression should be considered. Although this may seem intuitive, exact comparison between surgical groups (initial-surgery vs. conservative+surgery) and their respective neurological outcomes in patients with SAC had not been published.
At 1 year, postoperative MNS were noted to be significantly higher in both surgical groups, when compared to the conservative group, a trend that was not observed at their 6-week or 6-month follow-up (Fig. 5B–D). This data highlights the potential long-term worsening neurological symptoms of patients who undergo surgical intervention regardless of preoperative observational status. We hypothesize that this worsening in neurological function can be attributed to more severe disease and natural progression of the cyst itself compared to patients with less severe disease who were managed completely conservatively.
2. Radiological Diagnosis
MRI is considered the gold standard diagnostic tool with a high sensitivity and specificity for correctly diagnosing CSF containing lesions and its ability to demonstrate anatomical location, relationship between the spinal cord and arachnoid cyst, and cyst laterality which has been shown to correlate with fistula level in extradural SAC [2,3,16]. The scalpel sign is often mentioned as a useful radiographical manifestation of the abrupt buckling of the spinal cord most commonly seen with SAC [17]. MRI can also demonstrate intrinsic cord signal which may be helpful in predicting neurological outcome. Additional imaging modalities, such as the more invasive CT myelogram, are useful tools which allow for identification of communicating tracts between the cyst wall and the main subarachnoid space. However, cyst communication may be missed on myelogram due to factors such as patient positioning in relation to CSF flow dynamics and variable location of communicating tracts [18]. Literature is lacking on whether CT myelogram confers additional clinical benefits in treatment of patients. Our data suggests that postoperative cyst recurrence rates were similar in patients who underwent preoperative MRI alone versus MRI+CT myelogram (p > 0.99). CT myelogram should therefore be reserved for those with inconclusive MRI findings as its usefulness as an adjunct tool from a surgical outcome perspective remains questionable.
Intraoperative US is an increasingly popular and useful tool that has been shown to reduce spinal incision length, laminectomy levels, and positively change intraoperative course. In a previous study by Harel and Knoller [19] intraoperative US changed the surgical course in 49 out of 78 cases (63%) without any related complications. In the present study, intraoperative US was utilized in 57% of cases to help identify cyst location prior to dural opening and to confirm the extent of cyst resection. While intraoperative US has been shown to have benefits, our data suggests that the use of intraoperative US does not seem to have an influence on cyst recurrence rates in patients who underwent intraoperative US versus those who did not.
3. Limitations
Our study has limitations. Its retrospective nature likely led to sampling and design biases. Additionally, although MNS is a validated measure to assess neurofunctional status, it requires a subjective investigator determination, risking selection, confirmation, measurement, and historical bias. This study was also limited by its small sample size, homogenous patient population, and single institution nature.
CONCLUSION
Although a significant proportion of patients who were initially managed conservatively ultimately underwent surgery secondary to symptom progression and/or neurological decline, delayed surgical intervention in minimally symptomatic patients does not seem to result in worse long-term neurofunctional outcomes. At 1 year, postoperative MNS were noted to be significantly higher in both surgical groups, when compared to the conservative group. This data highlights the potential long-term worsening neurological symptoms of patients who undergo surgical intervention regardless of preoperative observational status. Treatment of SACs remains controversial and dependent on surgical attending preference as the natural history of SAC progression is still poorly defined.
Notes
Conflict of Interest
Michael Finn is a consultant for K2M/Stryker. The other authors have nothing to disclose.
Funding/Support
This study received no specific grant from any funding agency in the public, commercial, or not-for-profit sectors.
Author Contribution
Conceptualization: GC, MF; Data curation: GC, KS, MK, SS, RW; Formal analysis: GC, MK, PH; Methodology: GC; Project administration: GC, KS; Visualization: GC, KS; Writing - original draft: GC, KS; Writing - review & editing: GC, KS, MK, SS, AS, MF.
Acknowledgements
Elements of this work were accepted as an abstract and presented at the Congress of Neurological Surgeons 2021 Annual Scientific Meeting in Austin, Texas.