The Prediction of Neurological Prognosis for Cervical Spondylotic Myelopathy Using Diffusion Tensor Imaging
Article information

Abstract
Objective
Although cervical spondylotic myelopathy (CSM) can be easily diagnosed using magnetic resonance imaging (MRI), prediction of surgical effect using preoperative radiological examinations remains difficult. In previous studies, it was reported that diffusion tensor imaging (DTI) may be used for the prediction of surgical effect; however, these studies did not consider the influences of spinal cord compression even though the values of DTI indexes can be distorted by compressive lesions in patients with CSM. Therefore, it is uncertain whether preoperative DTI indexes can actually predict the surgical effect. The aim of this study was to investigate DTI metrics that are hardly affected by spinal cord compression and can accurately predict neurological status after decompressive surgery.
Methods
Twenty-one patients with CSM who underwent surgery and 10 healthy volunteers were enrolled in this study. The subjects underwent cervical MRI, and values of DTI indexes including axial diffusivity (AD), radial diffusivity (RD), apparent diffusion coefficient (ADC), and fractional anisotropy (FA) were recorded at each intervertebral level. Further, the Japanese Orthopaedic Association (JOA) score of each patient with CSM was recorded before and after surgery for neurological status evaluation. Preoperative and postoperative values of DTI indexes were compared, and correlations between preoperative DTI parameters and postoperative neurological recovery were assessed.
Results
After surgery, the lesion-adjacent (LA) ratios of RD and ADC increased (p = 0.04 and p = 0.062, respectively), while the LA ratio of FA decreased (p = 0.075). In contrast, the LA ratio of AD hardly changed. A negative correlation was observed between preoperative LA ratio of AD and JOA recovery rate 6 months after surgery (r = -0.379, p = 0.091). Based on preoperative LA ratio of AD, the patients were divided into a low AD group and a high AD group, and JOA recovery rate 6 months after surgery was found to be higher in the low AD group than in the high AD group (p = 0.024).
Conclusion
In patients with CSM, preoperative LA ratio of AD is seldom affected by spinal cord compression, and it negatively correlates with JOA recovery rate 6 months after surgery.
INTRODUCTION
Cervical spondylotic myelopathy (CSM) is a major cause of cervical spinal cord dysfunction, especially in elderly patients [1]. Due to spinal degeneration and consequent cervical spinal cord compression, CSM is often associated with several symptoms. Magnetic resonance imaging (MRI) is the gold standard imaging modality for CSM diagnosis and treatment strategy design. Conventional MRI can reveal compression factors, including the intervertebral disc, ligamentum flavum, vertebral osteophyte, facet joint, and ossification of posterior longitudinal ligament, and T2-weighted hyperintensity in cord parenchyma. In addition, conditions of cervical spinal components including disc degeneration, Modic changes, and facet joint degeneration can be assessed by conventional MRI [2,3]. However, it is difficult to predict surgical effect using only conventional MRI.
Diffusion tensor imaging (DTI) has been gaining popularity in the assessment of spinal cord microstructure [4,5]. It can be used to evaluate the magnitude and direction of water molecule diffusion [6], and it allows for the calculation of various indexes using diffusivities along the 3 principal axes. DTI can be used for spinal cord evaluation given that the spinal cord is an elongated organ and water molecules tend to diffuse in the axonal direction. Several studies on CSM evaluation using DTI have been conducted, and some of the studies revealed correlations between preoperative DTI parameters and postoperative neurological function; however, they did not consider the effect of cord compression before surgery. It was reported that values of DTI indexes can be distorted by compressive lesions; this phenomenon is known as aligned fibers effect [7]. Some DTI indexes may be modified under cord compression, making for inaccurate prediction of surgical effect in patients with CSM. The aim of this study was to investigate DTI metrics that are hardly affected by spinal cord compression and can accurately predict postoperative neurological prognosis.
MATERIALS AND METHODS
This study was approved by the Institutional Review Board of Otaru General Hospital (approval number: 30-009), and informed consent was obtained from all study participants.
1. Participants
Twenty-three patients with CSM who underwent surgery at Otaru General Hospital between May 2016 and November 2017 were enrolled in this study. The patients underwent MRI before surgery and a week after surgery, Japanese Orthopaedic Association (JOA) score was used to evaluate the neurological status of the patients, and JOA recovery rate was determined 6 months after surgery [8]. Two of the 23 patients with C6/7 intervertebral level as the most compressed intervertebral level were excluded from the study because of significant errors in DTI indexes due to respiratory artifact [9]. In addition, 10 healthy volunteers were included in this study, and cervical MRI was performed on the healthy volunteers to obtain normal values of DTI indexes.
2. Image Acquisition
Cervical spinal cord MRI was performed using a 3.0-Tesla MRI scanner (Ingenia, Philips, Best, The Netherlands), and zonally oblique multislice (ZOOM) DTI sequences were used as described in a previous study [10]. DTI was performed using a single-shot spin-echo sequence under the following scan parameters: repetition time/echo time = 4,500/63 msec, field of view= 70× 47 mm2, slice thickness= 5 mm, number of sample averages= 10, and b-value= 600 sec/mm2. The scan range was C2 to C7. From the obtained DTI data, axial diffusivity (AD), radial diffusivity (RD), apparent diffusion coefficient (ADC), and fractional anisotropy (FA) maps were generated. By checking the 3-dimensional region of interest (ROI) square, the maximum possible ROI was manually placed on the cord without including cerebrospinal fluid.
3. Data Assessment
According to a previous study, values of DTI parameters differ across spinal cord levels [9]. Further, absolute values of DTI parameters differ between individuals. Therefore, it is difficult to compare DTI parameters between spinal cord levels or between patients. To circumvent this drawback, the ratio of the value of interest at the level of the lesion to the mean value at the adjacent superior and inferior intervertebral levels, i.e., the lesion-adjacent (LA) ratio, was calculated (Fig. 1).
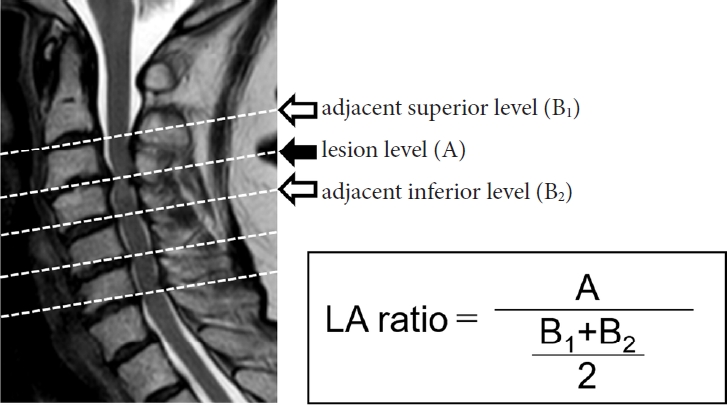
Lesion-adjacent (LA) ratio. LA ratio is defined as the ratio of the value at the level of the lesion (A) to the mean value at the adjacent superior (B1) and inferior (B2) intervertebral levels.
4. Statistical Analysis
The acquired data are presented as mean ± standard deviation (SD). Statistical analyses were performed using JMP Pro 14 software (SAS Institute Inc., Cary, NC, USA). One-way analysis of variance was used to compare groups, and differences in DTI parameters before and after decompression surgery were evaluated using paired t-test. Student t-test was used to compare 2 independent groups. Pearson correlation analysis was performed to determine correlations between the LA ratio of preoperative DTI parameters and JOA recovery rate. Statistical significance was set at p< 0.05.
RESULTS
1. Participant Characteristics
The demographic data of patients and healthy volunteers are shown in Table 1. There were 21 patients (13 men and 8 women) aged 42–92 years old and 10 healthy volunteers (7 men and 3 women) aged 23–49 years old. The most compressed spinal level was C3/4 in 4 patients, C4/5 in 8 patients, and C5/6 in 9 patients. The mean preoperative JOA score was 10.0± 4.3. Of the 21 patients, 12 underwent anterior cervical discectomy/corpectomy and fusion, while 9 underwent laminoplasty.
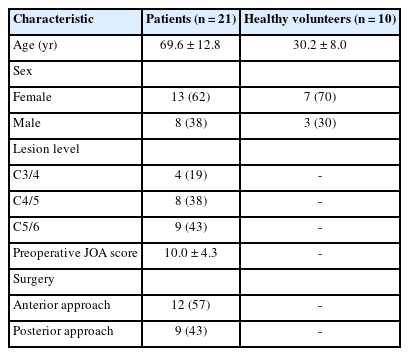
Participants’ characteristics
2. DTI Parameters in Healthy Volunteers
Table 2 shows a comparison of the raw data and LA ratio of DTI parameters at the C3/4, C4/5, and C5/6 intervertebral levels of healthy volunteers. Regarding the raw data, statistically significant differences in the mean values of RD, ADC, and FA at the intervertebral levels were observed (p= 0.007, p= 0.013, and p= 0.02, respectively). In contrast, the mean values of LA ratio of DTI indexes (except AD) were generally distributed around 1.00 and did not differ between intervertebral levels. Thus, for comparison between intervertebral levels, LA ratio can be considered more appropriate than absolute value.

Diffusion tensor imaging parameters in normal healthy participants
3. Changes of DTI Parameters After Surgery in Patients With CSM
The changes between preoperative and postoperative LA ratios of DTI parameters at the most compressed level are shown in Table 3. After surgery, the LA ratio of RD significantly increased (p= 0.04) and that of ADC showed an increasing trend, while the LA ratio of FA showed a decreasing trend. In contrast, there was almost no difference between preoperative and postoperative LA ratios of AD.

Pre and postoperative diffusion tensor imaging parameters in patients
4. Correlations Between Preoperative DTI Parameters and the JOA Recovery Rate
A negative correlation was observed between preoperative LA ratio of AD and JOA recovery rate 6 months after surgery (r= -0.379, p= 0.091) (Fig. 2A). In contrast, no correlation was observed between the preoperative LA ratios of the other parameters and JOA recovery rate (Fig. 2B–D).
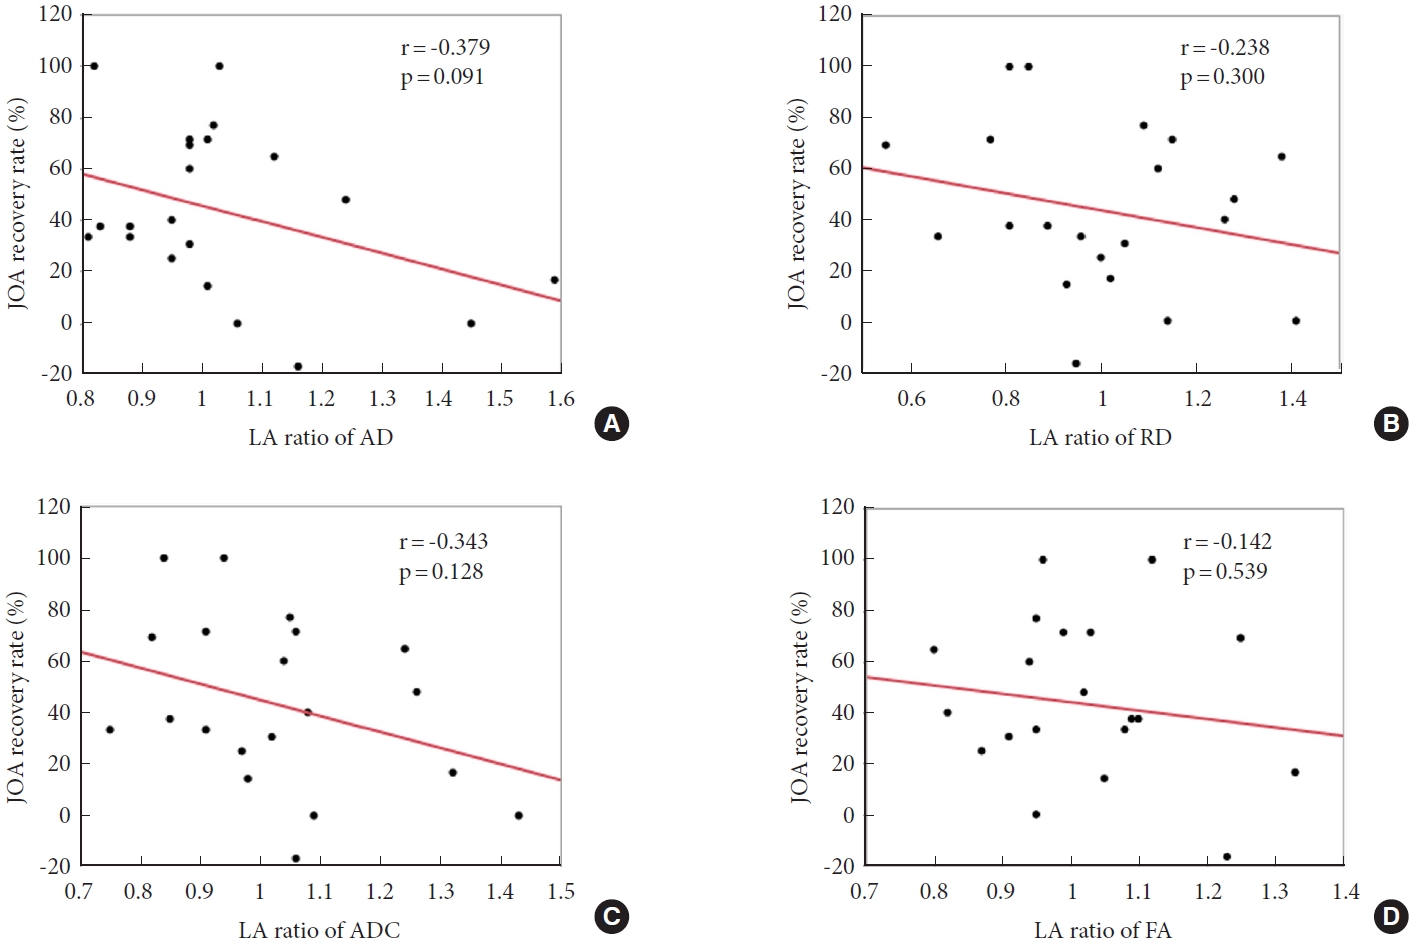
Correlations between preoperative DTI parameters and JOA recovery rate. Preoperative LA ratio of AD (A) negatively correlates with JOA recovery rate 6 months after surgery (r=-0.379, p=0.091). In contrast, preoperative LA ratios of RD (B), ADC (C), and FA (D) do not correlate with JOA recovery rate. DTI, diffusion tensor imaging; JOA, Japanese Orthopaedic Association; LA, lesion-adjacent; AD, axial diffusivity; RD, radial diffusivity; ADC, apparent diffusion coefficient; FA, fractional anisotropy.
Based on preoperative LA ratio of AD, patients with CSM were divided into 2 groups: high AD group (or group H) and low AD group (or group L). Group H was defined that the preoperative LA ratio of AD at the most compressed level was greater than mean value+2SD in healthy volunteers, whereas group L was defined that it was less than mean value+2SD. Therefore, cutoff values between group H and L were 1.21 for C3/4 level, 1.09 for C4/5 level, and 1.12 for C5/6 level. Further, JOA recovery rate 6 months after surgery was higher in group L than in group H (Fig. 3) (p= 0.024).

Comparison of mean JOA recovery rate between the high AD and low AD groups. Patients with CSM were divided into a high AD group (or group H, with LA ratio greater than mean value+2SD in healthy volunteers) and a low AD group (or group L, with LA ratio less than mean value+2SD in healthy volunteers). JOA recovery rate 6 months after surgery was significantly higher in group L than in group H. Data are presented as mean±standard deviation. JOA, Japanese Orthopaedic Association; AD, axial diffusivity; CSM, cervical spondylotic myelopathy; SD, standard deviation. *p<0.05.
DISCUSSION
This study revealed that, in patients with CSM, surrounding degenerative structures hardly affect AD but easily affect RD, ADC, and FA. In addition, the results of this study suggest that postoperative neurological recovery negatively correlates with preoperative AD but does not correlate with the other DTI indexes.
There have been multiple studies on DTI in spinal cord disorders such as amyotrophic lateral sclerosis [11,12] and spinal cord injury [13]. Such studies demonstrated that FA decreased whereas ADC increased; this is acceptable as these disorders do not usually involve compressive lesions and DTI purely reflects nerve conditions. However, most previous studies on CSM reported decreased FA and increased ADC in patients compared with healthy controls, although DTI values should have been affected by compressive lesions [14-20]. These results are contrary to the finding in this study of increased FA value and decreased ADC value at the compressed intervertebral level. These differences in findings may be due to differences in image resolution. Since the spinal cord is surrounded by cerebrospinal fluid whose diffusivity in any direction is high, DTI values will be inaccurate if there is ROI protrusion from the spinal cord surface [21]. Longitudinal neuronal fibers, which are responsible for the high FA value of the spinal cord, are unevenly distributed in the surface layer [22]; therefore, insufficient ROIs result in unreliable DTI values. The results of our other study on muscle FA value support the findings of this study [23]. In this study, the FA value of muscle fibers was found to be increased by compression similar in nature to spinal cord compression. Unlike earlier studies that used 1.5-Tesla MRI scanners, we used a 3.0-Tesla MRI scanner to obtain high-resolution images. In addition, we used a ZOOM DTI technique to obtain images with fine contrast. We previously reported that, in terms of visibility and with regard to interrater and intrarater reliability, ZOOM DTI is superior to conventional DTI [10]; hence, with ZOOM DTI, the spinal cord surface is easily distinguishable.
Unlike FA and ADC, AD and RD have not been extensively focused on in previous studies. AD represents diffusivity parallel to axonal fibers, while RD represents diffusivities perpendicular to axonal fibers [24]. Consideration of these directions is important in the evaluation of CSM. Zheng et al. [25] focused on DTI parameters, including AD and RD. They showed that AD is different in behavior than RD, ADC, and FA, and this finding is consistent with the results of this study. Our study results suggest that spinal cord compression affects RD value but hardly affects AD value. This result is in line with the fact that spinal cord compression mainly occurs perpendicular to axonal fibers (Fig. 4).
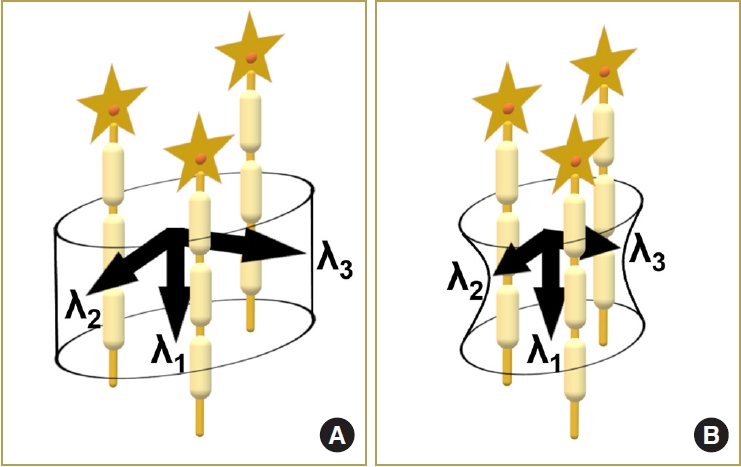
Schema of diffusivities in normal spinal cord and compressed spinal cord. Compared to the normal spinal cord (A), the compressed spinal cord (B) has decreased diffusivities perpendicular to the nerve fibers (λ2 and λ3), and its diffusivity parallel to the nerve fibers (λ1, or axial diffusivity) is not significantly changed.
There is no consensus regarding the correlation between preoperative DTI parameters and postoperative neurological outcome [5]. Jones et al. [26] did not report a significant correlation between preoperative FA value and postoperative JOA score. Further, Wang et al. [27] reported a significant positive correlation between preoperative FA value and JOA recovery rate and a significant negative correlation between preoperative ADC value and JOA recovery rate. In the study by Vedantam et al. [28], it was reported that preoperative FA value may have a negative correlation with JOA score change. However, all the above-mentioned studies did not consider the compressed intervertebral level and the preoperative modification resulting from cord compression. In this study, we used the LA ratio to minimize the difference due to the affected level and found that postoperative neurological improvement correlates negatively with preoperative AD value but does not correlate with other DTI indexes. This finding is logical given that we found no differences between the preoperative and postoperative values of AD.
This study has some limitations. The evaluated intervertebral levels were limited to C3/4, C4/5, and C5/6 to calculate LA ratio; therefore, our result cannot apply patients with CSM showing compression at other levels. Moreover, most of the patients included in this study were elderly, and they might have other lesions such as lumbar canal stenosis, which could lead to an underestimation of JOA score.
CONCLUSION
Although compressive lesions in patients with CSM affect most preoperative DTI indexes, they seldom affect preoperative AD value. Moreover, preoperative AD value may have a negative correlation with JOA recovery rate 6 months after decompressive surgery; therefore, preoperative AD value may be used to predict postoperative neurological improvement in patients with CSM.
Notes
Conflict of Interest
The authors have nothing to disclose.
Funding/Support
This study received no specific grant from any funding agency in the public, commercial, or not-forprofit sectors.
Author Contribution
Conceptualization: ST, MI; Data curation: ST, TY, DO; Formal analysis: ST; Methodology: ST, TY, DO; Visualization: ST; Writing - original draft: ST; Writing - review & editing: MI, YN, MF.