Lower Extremity Motor Deficits Are Underappreciated in Patient-Reported Outcome Measures: Added Value of Objective Outcome Measures
Article information

Abstract
Objective
The patient-reported outcome measure (PROM)-based evaluation in lumbar degenerative disc disease (DDD) is today’s gold standard but has limitations. We studied the impact of lower extremity motor deficits (LEMDs) on PROMs and a new objective outcome measure.
Methods
We evaluated patients with lumbar DDD from a prospective 2-center database. LEMDs were graded according to the British Medical Research Council (BMRC; 5 [normal] –0 [no movement]). The PROM-based evaluation included pain (visual analogue scale), disability (Oswestry Disability Index [ODI] & Roland-Morris Disability Index [RMDI]), and health-related quality of life (HRQoL; Short-Form 12 physical component summary/mental component summary & EuroQol-5D index). Objective functional impairment (OFI) was determined as age- and sex-adjusted Timed-Up and Go (TUG) test value.
Results
One hundred five of 375 patients (28.0%) had a LEMD. Patients with LEMD had slightly higher disability (ODI: 52.8 vs. 48.2, p = 0.025; RMDI: 12.6 vs. 11.3, p = 0.034) but similar pain and HRQoL scores. OFI T-scores were significantly higher in patients with LEMD (144.2 vs. 124.3, p = 0.006). When comparing patients with high- (BMRC 0–2) vs. low-grade LEMD (BMRC 3–4), no difference was evident for the PROM-based evaluation (all p > 0.05) but patients with high-grade LEMD had markedly higher OFI T-scores (280.9 vs. 136.0, p = 0.001). Patients with LEMD had longer TUG test times and OFI T-scores than matched controls without LEMDs.
Conclusion
Our data suggest that PROMs fail to sufficiently account for LEMD-associated disability, which is common and oftentimes bothersome to patients. The objective functional evaluation with the TUG test appears to be more sensitive to LEMD-associated disability. An objective functional evaluation of patients with LEMD appears reasonable.
INTRODUCTION
Lumbar degenerative disc disease (DDD) is a heterogenous condition that may lead to varying degrees of – but often considerable – low back and sciatic leg pain, disability, and loss of health-related quality of life (HRQoL). Moreover, 40%–82% of patients suffering from lumbar DDD —in particular those with a lumbar disc herniation (LDH)—present with mild to severe lower extremity motor deficits (LEMDs) secondary to nerve root or cauda equina compression [1].
The presence of LEMDs can be extremely frightening and distressing to patients [2], and it is reported that LEMDs strongly affect functional outcomes and rehabilitation potential [3]. Other studies found, nonetheless, no association between LEMDs and patient-reported outcome measures (PROMs) [4]. Without question, LEMDs translate into higher disability but controversy remains, whether this disability resulting from LEMDs is evident and quantifiable in commonly used subjective PROMs, the current gold standard of outcome assessment. Over the last decades objective tests of function have increasingly complemented the comprehensive patient evaluation and those may be more sensitive towards disability resulting from LEMDs [5]. However, no prior study evaluated whether the presence of LEMDs leads to more objective functional impairment (OFI) in these tests.
We thus set out to explore the relationship between presence and severity of LEMDs and both the subjective (PROM-based) and OFI-based patient evaluation. Furthermore, in the discussion part of the manuscript, we perform an in-depth analysis of how disability is reflected by PROMs in previous literature and whether OFI should be assessed in patients with lumbar DDD. A representative case vignette is presented to illustrate the added benefit of the objective functional evaluation.
MATERIALS AND METHODS
This was a secondary analysis of a prospective 2-center database. The study was approved by the Institutional Review Board (IRB) of the University of Geneva (IRB No. 14-079) and the Ethics Committee St. Gallen (IRB No. 14/049). All patients gave written informed consent.
1. Patient Population
Consecutive patients with lumbar DDD scheduled for elective spine surgery with the following diagnoses were included: (1) LDH, (2) lumbar spinal stenosis (LSS), or (3) any type of lumbar DDD with or without instability requiring lumbar fusion surgery (FUS). We did not consider patients < 18 years of age, pregnant patients or those with severe disability or prior LEMDs from significant comorbidities (nonspine related; e.g., hip or knee osteoarthritis, stroke, peripheral neuropathy, etc.).
2. Data Collection & Grading of Motor Deficits
All patients were examined preoperatively by a board-certified neurosurgeon. For the purpose of this research we collected baseline patient- and disease-specific characteristics, including age, sex, body mass index (BMI), smoking status, anesthesia risk (American Society of Anesthesiologists physical status classification risk score), working status, type of intended surgical procedure, as well as affected lumbar spinal segments and laterality.
Muscle strength was tested systematically from the foot to the thigh. The motor function of the fibular muscles, the common extensor of the toes, the sural triceps, the long extensor of the hallux, the anterior tibial, the quadriceps, and the flexors of the hip were all tested. Presence and severity of LEMDs of segmentindicating muscles corresponding to the affected nerve root(s) were determined. For this, the L2 (and L3) roots were considered to correspond to the hip flexors, the L3 (and L4) roots to the knee extensors, the L4 (and L5) roots to the foot dorsiflexors, the L5 roots to the hallux extensor, and the S1 roots to the plantar flexors and foot eversors. As done in previous studies [1,4,6], we assessed LEMDs by manual testing and graded their severity according to the British Medical Research Council (BMRC) scale:
• Grade 5: Muscle contracts normally against full resistance
• Grade 4: Muscle strength is reduced but muscle contraction can still move joint against resistance
• Grade 3: Muscle strength is further reduced such that the joint can be moved only against gravity with the examiner’s resistance completely removed
• Grade 2: Muscle can move only if the resistance of gravity is removed
• Grade 1: Only a trace or flicker of movement is seen or felt in the muscle or fasciculations are observed in the muscle
• Grade 0: No movement is observed
In case LEMDs were observed in more than one muscle group, any highest degree of LEMD in a lower extremity muscle was noted. Severity of LEMD was dichotomized into low-grade (BMRC grades 3 & 4) and high-grade (BMRC grades 0–2).
3. Subjective Outcome Measures
The following PROMs were obtained in each patient:
• Low back pain and radicular leg pain, graded on the visual analogue scale (VAS; ranging from 0 to 10) [7]
• Disability, measured with the validated disease-specific Roland-Morris Disability Index (RMDI; 24 items, ranging from 0 [no disability] to 24 [severe disability]) [8] and Oswestry Disability Index (ODI; 10 items, ranging from 0 [no disability] to 100 [severe disability]) [9]
• HRQoL, estimated using the EuroQol-5D (EQ-5D; 5 items, ranging from 1 [best HRQoL] to -0.074 [worst HRQoL] using the European norms) [10], as well as the Short-Form 12 (SF-12; 12 items, results standardized to a mean of 50) with its 2 composite scores, the physical- (PCS) and mental component summary (MCS) [11].
4. Objective Functional Assessment
The Timed-Up and Go (TUG) test is the most commonly used objective and most standardized functional test for patients with lumbar DDD [5]. It was performed in a standardized manner [12-15]. On the words “Three, Two, One – Go!”, patients got up from a chair with an arm rest, walked as fast as possible (without running) to a line in 3-m distance. Then, they would turn around by 180° and return—again, as fast as possible—to the chair and sit down (Fig. 1). Patients may wear their regular shoes and use a walking aid, if required. The time between getting up from the chair and sitting back down was recorded. Raw TUG test times (in seconds) were transformed into OFI T-scores, based on age- and sex-adjusted normative data, with T-scores > 123 representing values that exceed the 99th percentile of the normal population and are thus indicative of “disability.” [13,15] OFI T-scores were conveniently calculated with the free “TUG app” (Fig. 1; see Appendix).
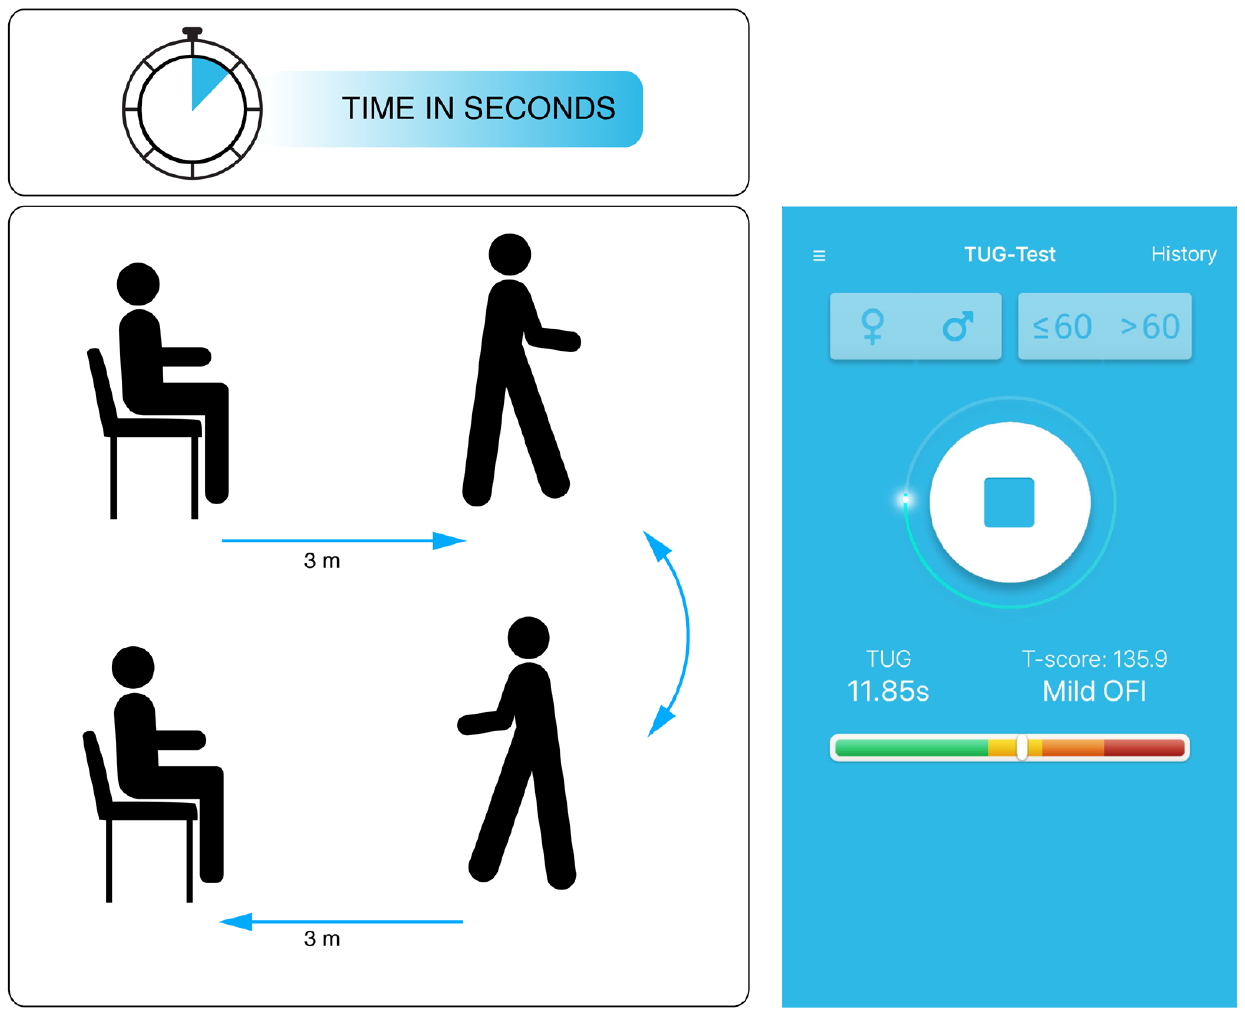
Schematic illustration of the Timed-Up and Go (TUG) test (left side) and view of the free “TUG app” (for more information see appendix). In this example the TUG test was performed by a 58-year-old female patient in 11.85 seconds, which translated into an objective functional impairment (OFI) T-score of 135.9 (mild objective functional impairment).
Previous research demonstrated a higher patient-acceptance of TUG assessments when compared to PROM-based questionnaires [16]. Furthermore, benefits of the TUG-based assessment are the relative independence of TUG test results for age [17], sex [18], smoking status [19], BMI [20], and mental health status/depressive comorbidity [21]. Myotome-specific TUG test results are not yet available.
5. Study Groups & Statistical Considerations
The presence or absence of a LEMD on the examination determined allocation of a patient to the study- or control group, respectively, and both were mutually exclusive. Baseline demographic- and disease-specific characteristics were compared applying Student t-tests or chi-square tests for nominal or categorical variables. T-tests also served to compare PROMs, raw TUG test times and OFI T-scores between groups. The effect sizes and clinical relevance of observed intergroup differences were evaluated by comparing them to the commonly accepted minimum clinically-important difference (MCID) of the PROMs (VAS back pain 1.2; VAS leg pain 1.6; RMDI 5.0; ODI 12.8; SF-12 PCS 4.9; EQ-5D index 0.140) and the TUG test (3.4 seconds) [11,14,22-24].
To further explore the relationship between LEMDs and subjective and objective measures of pain, disability and HRQoL, subgroup analyses comparing low- versus (vs.) high-grade LEMDs were conducted.
Lastly, we matched each one patient with LEMD from the LDH, LSS and FUS group to a control patient without LEMD but otherwise sharing as many similar characteristics (age, sex, BMI) as possible. We compared OFI T-scores in matched pairs.
RESULTS
1. Study Cohort
One hundred and five of 375 patients (28.0%) had a LEMD. Severity was BMRC grade 4 in 82 (78.1%), grade 3 in 17 (16.2%), grade 2 in 4 (3.8%) and each one patient was diagnosed BMRC grade 1 and 0, respectively (Fig. 2). Baseline demographic variables of patients with or without LEMD are illustrated in Table 1. The study groups were well-balanced, except for a higher proportion of patients with LDH scheduled for microdiscectomy in the LEMD group.

Bar chart illustrating the distribution of paresis grades, according to the British Medical Research Council (BMRC; ranging from 5 [full strength] to 0 [no motor activity]), across the study cohort (n=375).
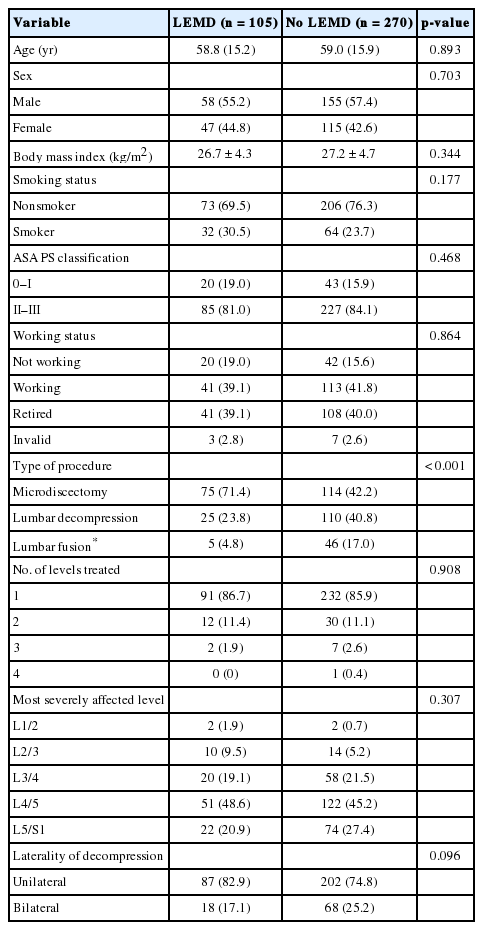
Baseline demographic information of 270 patients without and 105 patients with a lower extremity motor deficit (LEMD)
2. Subjective and Objective Pain, Disability, and HRQoL Measures
Patients with LEMD had slightly more disability as measured by the ODI and RMDI, but similar scores for back and leg pain, and HRQoL (Table 2). The mean difference between groups for all PROMs were well below their commonly accepted MCIDs.
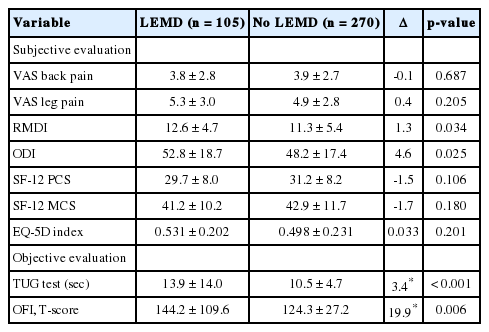
Subjective and objective measures of pain, disability and health-related quality of life of 270 patients without and 105 patients with a lower extremity motor deficit (LEMD)
Patients with LEMD had significantly longer TUG test times, which translated into higher OFI T-scores (Table 2). The mean difference between the groups was within the range of the TUG test’s MCID (3.4 seconds) [14].
3. Subgroup Analysis: High-Grade vs. Low-Grade Motor Deficit
Six of 105 patients (5.7%) with LEMD had a high-grade LEMD. Patients with high- or low-grade LEMD had comparable PROM results for pain, disability and HRQoL (all p > 0.05) (Table 3). Except for the SF-12 PCS, the mean difference between the groups for PROMs were well below their commonly accepted MCIDs.

Subjective and objective measures of pain, disability and health-related quality of life of 99 patients with low-grade and 6 patients with high-grade lower extremity motor deficit (LEMD)
Patients with high-grade LEMD had significantly longer TUG test times than patients with low-grade LEMD, which translated into higher OFI T-scores (Table 3). The mean difference between the groups well exceeded the TUG test’s MCID.
4. Matched Pairs
For all 3 matched pairs, TUG test times were considerably longer in patients with grade-4 LEMDs, the difference exceeding the TUG test’s MCID in each case.
DISCUSSION
This study set out to explore the association between presence and severity of LEMDs and both the subjective (PROM-based) and objective (OFI-based) patient evaluation. Our results indicate that a solely PROM-based outcome evaluation is insufficient to account for disability resulting from LEMDs. This is because most disease-specific PROM instruments for spine patients focus on pain as a chief complaint, including the VAS (exclusively a pain measure) [7], the ODI (all 10 items deal with restrictions due to pain, e.g., in personal care, lifting, walking, etc.) [9], or the RMDI (23 out of 24 items describe limitations resulting from low back pain) [8]. The generic PROM instruments, such as the SF-12 (1 out of 12 items assess pain) [11] or the EQ-5D (1 out of 5 items assess pain) [10] are more inclusive with respect to the cause of disability being different from pain. Even though it was demonstrated that leg pain represents the most bothersome symptom in patients with lumbar radiculopathy, compared to leg paresthesia (25% less bothersome) or weakness (40% less bothersome) [25], LEMD can be detrimental to the individual patient’s sportive or professional activity and quality of life. Some degree of LEMD is frequently encountered before and can persist even after surgery for lumbar DDD, but the patient’s condition is commonly described using the mentioned PROMs. Only few studies today include results of physical examinations (motor, sensory, or reflex abnormalities), whereas their importance along leg pain has been emphasized [25]. Adding objective functional tests to the comprehensive patient evaluation has increased over the last decade, but still remains underutilized [5]. As disability resulting from LEMD is not well represented by PROMs (Tables 2–4), it should be acknowledged that studies that make use of these PROMs are bound to fail to demonstrate superiority of one treatment over another for patients that suffer from LEMD-associated disability [4].

Three patients with LEMD (each one with LDH, LSS, and degenerative disc disease requiring a FUS) are matched for basic patients- and disease-specific characteristics to 3 patients without LEMD
Our current findings show that including an objective test of function may be helpful for measuring LEMD-associated disability. The TUG test is the most commonly applied objective test of function for patients with lumbar DDD [5]. It is quick, well-appreciated by patients [16], and represents many daily activities where patients with lumber DDD struggle (standing up, walking fast, changing direction, sitting down). Besides, it combines many favorable test qualities including high reliability, validity, objectivity, responsiveness, and its MCID has been determined [12-15,21].
We here provide 3 lines of evidence that LEMD-associated disability can be determined by the TUG test.
First, patients with LEMDs had significantly longer TUG test times & higher OFI T-scores, indicating that their functional ability was lower than the one of patients without LEMDs (Table 2). The intergroup difference was within the range of the TUG test’s MCID, indicating that the group difference was clinically meaningful.
Second, statistically significant and clinically meaningful differences in OFI could be reproduced in subgroup analyses of patients with low- vs. high-grade LEMDs (Table 3).
Third, patients with and without LEMDs (but matched for other baseline characteristics) showed clinically meaningful differences in their TUG test results and OFI T-scores (Table 4). Since OFI T-scores are calculated based on age- and sex-adjusted normal population values, any influence of those variables on OFI could be excluded a priori [17,18]. Most other baseline variables were balanced between patients with or without LEMDs, respectively (Table 1). A higher rate of LEMDs in patients with LDH has been described previously and was also evident in our cohort, lending credibility to the underlying dataset [1,4].
Why is it important to determine OFI in patients with LEMDs? A frequently encountered scenario in clinical practice demonstrates the discordance of LEMD-associated disability and PROM values: A 43-year-old nonsmoking female patient (BMI 23.4 kg/m2) with a right-sided LDH at L5/S1 (Fig. 3A, B) and excruciating right S1 radicular pain but preserved strength decided for prolonged conservative therapy including an epidural steroid injection (ESI). She reported a marked, at least 70% improvement of her leg pain several days after the ESI. However, about 10 days after the ESI, she noticed that she had started to limp and encountered difficulties climbing up stairs. Upon presentation, her physician documented a BMRC 3 paresis of the right plantar flexors. At the same time, her pain was well-controlled, and the PROM-based assessment was VAS back pain 2, VAS leg pain 1, ODI 12%, RMDI 3, SF-12 PCS 41.3, SF-12 MCS 41.9, EQ-5D index 0.635. Because of her LEMD-associated mobility restriction, the baseline TUG test was 17 seconds, translating into an age- and sex-adjusted OFI T-score of 167.5. The patient underwent an uneventful L5–S1 microdiscectomy and was seen again 6 weeks postoperatively. At this point, her plantar flexion weakness had improved to BMRC 4+. However, the PROM-based assessment had not changed much (VAS back 1.5, VAS leg pain 0.5, ODI 16%, RMDI 4, SF-12 PCS 42.2, SF-12 MCS 54.8, ED-5D index 0.785; Fig. 3C) although her TUG test was markedly improved (10.9 seconds; OFI T-score 130.3; Fig. 3D). Of note, the 6-week OFI T-score exceeded the threshold of 123 and thus indicated that mild impairment continued to be present.
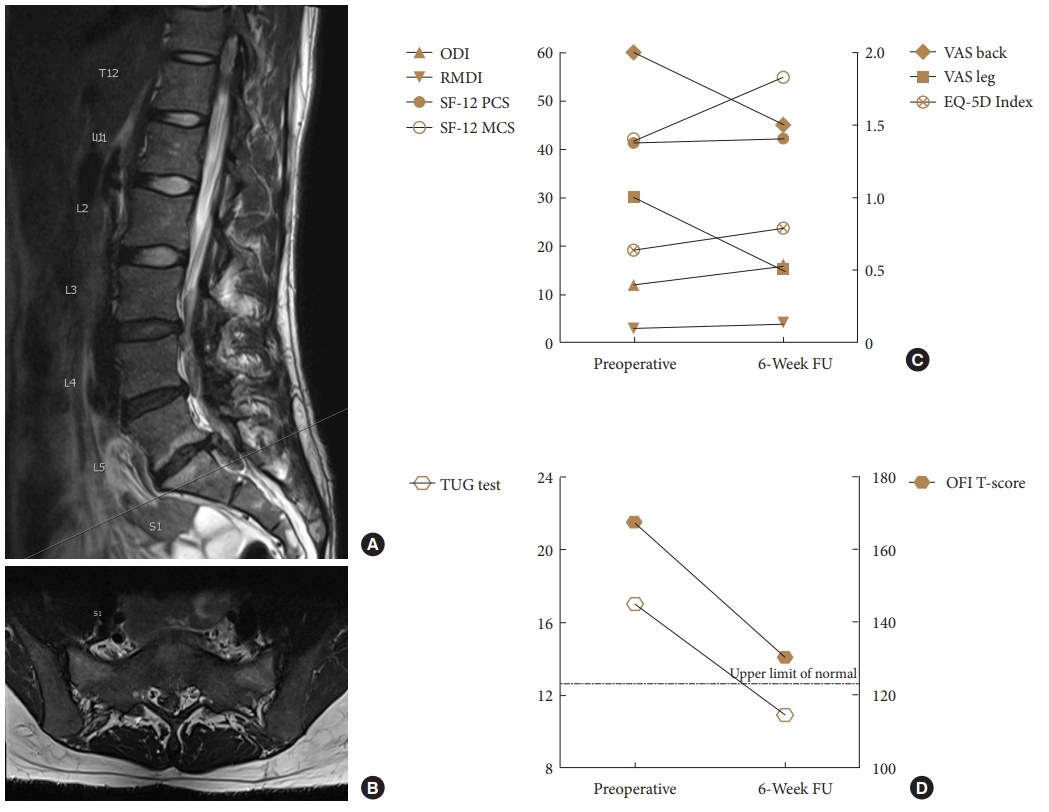
Illustrative case of a female patient with a right-sided L5–S1 lumbar disc herniation (A: sagittal T2-weighted magnetic resonance imaging MRI; B: axial T2-weighted MRI), who developed a grade-3 plantar flexion weakness and subsequently underwent microdiscectomy despite relatively low pain scores (C: VAS pain, ODI, RMDI, SF-12 PCS & MCS, EQ-5D index). At the 6-week follow-up (FU), her plantar flexion weakness had improved substantially (BMRC 4+), but the patient-rated outcome measures remained relatively stable. On the other hand, the objective TUG-based assessment revealed a clinically meaningful improvement in function (D: TUG test raw value in seconds; standardized OFI T-score). The dotted line indicates the OFI T-score threshold of 123, under which a TUG test result is considered within the normal population range (upper limit of normal). VAS, visual analogue scale; RMDI, Roland-Morris Disability Index; ODI, Oswestry Disability Index; SF-12 PCS, Short-Form 12 physical component summary; SF-12 MCS, Short-Form 12 mental component summary; EQ-5D, EuroQol-5D; TUG, Timed-Up and Go; OFI, objective functional impairment.
The case description serves to demonstrate that LEMDs will improve in particular situations although no clinically meaningful improvement can be documented with the PROM-based assessment. Moreover, there may be other situations where patients experience postoperative resolution of radicular pain and PROMs show great improvement of well-being, while LEMDs persist and go unnoticed in the assessment. Even extensively validated PROMs that are considered today’s gold standard of outcome measurement cannot fully capture the multiple facets of the patient’s clinical status, i.e., pain, disability, quality of life, and neurological status.
1. Previous Literature
Some groups previously provided insight into the relationship between LEMDs and the subjective patient well-being, as described by PROMs.
In 2010, Righesso et al. [4] reported 1-, 3-, 6-, 12-, and 24-month VAS pain and ODI results in 150 patients who underwent discectomy for LDH – including 135 patients with preoperative LEMDs (BMRC grade 4 in 133, BMRC grade 2 in 2). At the baseline examination, patients with LEMDs indicated slightly higher mean ODI values (48% vs. 42%, p = 0.020) and similar VAS pain scores (8.5 vs. 9.0, p = 0.834). The between-group differences were lower than the commonly accepted MCID-values for VAS pain and ODI [14,22,23], indicating that the difference in both PROMs would not have been perceived as clinically meaningful by the patient. In the postoperative setting the use of both VAS pain and ODI did not allow for the differentiation between patients with and without LEMDs. Accordingly, the authors concluded that PROMs such as the VAS and ODI do not suffice to describe the “true functional outcome” because they do not take into consideration neurological deficits of the limbs [4].
In 2011, Suzuki et al. [6] investigated risk factors for motor deficits in 76 consecutive patients with LDH at the L4–5 segment. Forty-three of those patients had LEMDs; 29, 6, and 8 patients LEMDs of BMRC grades 4, 3, or 2-0, respectively. The authors described lower Japanese Orthopedic Association (JOA) scores in patients with and without LEMDs (11.2 vs. 15.3, p < 0.05). As it was not the intention of the authors to determine the direct influence of LEMDs on PROMs, they did not specify whether these lower JOA scores resulted from the LEMDs or rather from other factors. Also, it is debatable whether the JOA counts as a PROM since only 9 points for subjective, patient-reported symptoms are accounted for, whereas most other parts of the JOA consist of physician-rated objective symptoms (6 points), restriction in ADLs (14 points), and urinary bladder function (6 points). Since motor disturbance accounts for 2 out of 29 possible points on the JOA, it is not surprising that a difference between LDH patients with and without LEMDs was detected [6].
In 2014, a retrospective analysis focused on a subgroup of 150 patients with LDH and BMRC grade 3 (n = 24) and 4 LEMD (n = 126), originally included into the randomized controlled Sciatica trial [1]. Compared to prolonged conservative therapy, LEMDs recovered faster in patients who were allocated to early surgical treatment but the recovery rates of LEMDs were similar after 1 year. The authors found that patients with persistent LEMDs at the 8-, 26-, or 52-week follow-up had slightly worse PROM results, including VAS leg pain (mean difference between 1.6 and 2.5), RMDI (mean difference between 3.6 and 4.9) and a self-constructed score representing satisfaction with recovery (all p < 0.05). The between-group differences were close to the commonly accepted MCID-values for VAS pain and RMDI [14,23], indicating that the difference in PROM-outcomes was clinically meaningful. However, PROM scores at baseline were not compared between patients with and without LEMDs in this study. This bears a substantial risk for bias in the analysis of the follow-up data since persistent nerve compression (in nonoperated or reherniated patients) may have led to both—persistent leg pain and LEMD [1]. The design of the study does not allow to conclude on the direct relationship between LEMDs and PROMs.
Finally, in a 2019 retrospective review of prospectively collected multicenter data from the Scoli-RISK-1 study, Tuchman et al. [3] reported the association between PROMs and neurological decline on the motor scale following adult spinal deformity correction. Of 265 patients, 32 (12%) had new uni- and 29 (11%) bilateral LEMDs. Over a 2-year postoperative follow-up, recovery to at least the baseline motor score was seen in approximately two-thirds of the patients. The authors noticed higher scores on the Scoliosis Research Society-22R (3.7 vs. 3.2, p = 0.009) and numeric rating score (NRS) for backpain (1 vs. 3, p = 0.048) at 2 years in patients with uni- as compared to those with bilateral LEMDs, indicating a positive association of LEMDs and those 2 subjective disability measures. However, they did not notice a difference on the NRS for sciatic leg pain, ODI, or SF36 PCS & MCS [3].
In summary, hints in the existing literature support a missing direct relationship between most PROMs and LEMD-associated disability. This current study was dedicated to analyze this relationship in more detail, adding novel data to a relevant question.
2. Strengths and Weaknesses
A strength of this analysis is the relatively large sample size of n = 375 patients (n = 105 with LEMDs), comparable to a similar report that investigated the relationship between PROMs and disability resulting from minor or major complications following lumbar spine surgery [26]. The prospective nature of the data collection guaranteed accurate documentation of the degree of LEMDs; retrospective studies have a high risk of introducing unintended biases as it is well-known that approximately half of all objective neurologic injuries are missed by retrospective chart review [27]. Finally, 3 different approaches to analyze the available dataset (total cohorts LEMD vs. no LEMD; subgroups with high- vs. low-grade LEMD; matched pairs) yielded the same results.
Weaknesses include that manual muscle testing was performed to diagnose and grade LEMDs. Although this technique is widely used in clinical practice and research [1,4,6], it has been criticized for lacking sensitivity and reliability, especially in patients with concurrent radicular leg pain which limits maximum force exertion. Quantitative isometric assessments might be more sensitive and specific in determining the exact degree of the deficits [1], but were not available. Lastly, despite the matching process, some minor differences between diagnose-specific pairs remained (Table 4).
CONCLUSION
In the era of evidence-based medicine, outcome after lumbar degenerative spine surgery is largely determined based on PROMs. PROMs have been a positive and necessary evolution from solely physician-rated outcome assessment before, but their limitations must be acknowledged. Our data suggest that PROMs fail to sufficiently account for LEMD-associated disability, which is common and oftentimes bothersome to patients. Information about the neurological status should accompany outcome reports. Alternatively, adding a simple and quick objective test of function to the comprehensive patient evaluation—such as the TUG test—may help filling this gap.
Notes
The authors have nothing to disclose.
Acknowledgements
The authors would like to thank Cornelia Lüthi (former study nurse of the Department of Surgery, Cantonal Hospital St. Gallen), Ivan Chau (former resident in neurosurgery, Cantonal Hospital St. Gallen), and Dario Jucker (former medical student of the University of Zurich) for their important contribution in the collection of data that are reported in this article. Martin N. Stienen thanks the AOSpine for the Young Researcher Award, which helped to finance the TUG app.
Appendices
The “TUG app” (Fig. 1, right side) is available for smartphones and can be downloaded free of charge from the Apple (https://itunes.apple.com/de/app/tug-app/id1119087707?mt=8) or Google app stores (https://play.google.com/store/apps/details?id=ch.webgearing.tugapp) in multiple languages, including English, German, French, Italian, Spanish, Portuguese, Turkish, Romanian, Hungarian, Dutch, Croatian, Arab, Chinese, Russian, and Albanian.