The Morphological Evaluation of the Cervical Muscle in Patients With Basilar Invagination: A Magnetic Resonance Imaging-Based Study
Article information

Abstract
Objective
To investigate the characteristics of functional muscle and muscle size in patients with basilar invagination (BI) and explore the effects of atlantoaxial dislocation.
Methods
Eighty BI patients (BI group) and 80 age- and sex-matched asymptomatic people (control group) were included. Axial T2 magnetic resonance imaging image was used to measure the cross-sectional area (CSA) and functional CSA (FCSA). The sternocleidomastoid (SCM), longus capitis and longus colli (LCap & LC), trapezius (Trap), splenius capitis (SpCap), splenius cervicis (SpC), semispinalis capitis (SSCap), semispinalis cervicis (SSC), multifidus (MS), levator scapulae (LS) and posterior deep layer muscles (PDLM) were evaluated. Correlations between age, atlantodental interval (ADI), Chamberlain distance and muscles were observed.
Results
BI group (39.4 ± 18.4 years; 33 males/47 females) exhibited significantly lower FCSA/CSA ratios than the control group in all extensor and flexor muscles, and presented smaller CSAs on the right and left Trap, SSC, LS, SCM, and left LCap & LC. FCSA/CSA ratios were significantly lower in BI patients with dislocation on the right Trap, SpCap, SpC, SSCap, MS, LS, LCap & LC, and PDLM, and the left SSCap, MS, and LCap & LC than in patients without deformity. Additionally, functional muscles of all parameters decreased with age in BI patients. Excluding children, the Trap, SpC, MS, and LS muscle sizes of BI patients tended to increase with age. ADI and Chamberlain distance tended to correlate negatively with FCSA/CSA ratio.
Conclusion
The BI patients, especially those with atlantoaxial dislocation, had less functional muscles compared with the control group. Moreover, their functional muscles decreased with age more obviously.
INTRODUCTION
Basilar invagination (BI) is known as deformity of the craniocervical junction (CVJ) region with or without clinical neural symptoms [1-3]. Our team conducted a series of research, focused on the changes in skeletal anatomy in BI patients and reported the characteristics of CVJ structures [4-6]. We previously found that the BI patients presented stiffer cervical alignment than the asymptomatic population [6]. It was deduced that the cervical muscles might contribute to the consequences. However, to the best of our knowledge, paraspinal muscle morphology has not been reported in BI patients.
The musculoskeletal function plays important role in spinal stability [7]. The paraspinal muscles have been widely studied in cervical spine-related diseases. Patients who had lost cervical lordosis had smaller muscle size in semispinalis capitis and cervical extensor muscles than normal people [8]. Individuals with chronic idiopathic neck pain had larger muscle volumes of the sternocleidomastoid (SCM) [9]. The fatty infiltration and asymmetry of cervical muscles were associated with clinical outcomes in patients with degenerative cervical myelopathy [10] or cervical spondylotic myelopathy [11]. The fatty infiltration of muscles was also studied in cervical deformity patients and was found to be alleviated after surgical correction and the achievement of lordotic curvature [7].
Since the physiotherapy and rehabilitation of BI patients commonly focus on the management of cervical musculoskeletal function after surgery or conservative treatments, understanding the morphology and features of cervical muscle in BI patients could guide medical workers to better treat patients and promote clinical efficiency. Therefore, this study aimed to investigate the characteristics of functional muscle and muscle size in BI patients and explore the effects of atlantoaxial dislocation in the cervical musculoskeletal system.
MATERIALS AND METHODS
1. Study Participants
This is a retrospective study, involving 80 BI patients (BI group) in our hospital in the past decade. Another 80 asymptomatic people (control group) were included by matching the age and sex of the BI group. Due to the skewed distribution of age of BI patients, we roughly divided all subjects into 4 age groups as following: (1) children group with age < 18 years old; (2) young adults with age between18 and 40 years old; (3) middle-aged adults with age between 41 and 55 years old; (4) old adults with age > 55 years old. The Ethic Committee of Nanfang Hospital approved this study (NFEC-BPE-120) and waived the procedure of informed consent.
The inclusive criteria were: (1) For BI group, although BI may be caused by multifactors, the inclusion of BI patients is mainly based on gold standard in radiological image: the odontoid process 5 mm (at least) above the Chamberlain line for BI group [2,12,13]. Patients met with the above criteria will be included, regardless of other kinds of accompanied malformation such as congenital Chiari malformation, syringomyelia, occipitalization of the atlas, atlantoaxial dislocation and extensive cervical vertebral fusions [3]; (2) For control group, subjects should have no congenital malformation at the cervical spine; (3) For both groups, all subjects should have clear T2-weighted magnetic resonance imaging (MRI) images on cervical spine with at least one image on axial view at the intervertebral disc. Images on sagittal view were used to confirm the disc levels. The exclusive criteria were: (1) only T1-weighted MRI image was available, or T2-weighted MRI image with low quality; (2) surgical history with implants on clivus, occipital, or cervical spine; (3) inflammation, tumors, or obvious space-occupying lesions on cervical muscles or bone structure; (4) diagnosis of cervical spondylosis, intervertebral disc herniation, or other severe degenerative diseases which were known to affect the cervical muscles.
2. Measurement of Muscle Size and Functional Muscle
Ten pairs of muscles, including the superficial and deep layers and anterior and posterior muscles, were selected in this study (Figs. 1, 2). To be specific, the anterior muscles were SCM, longus capitis (LCap), and longus colli (LC). Since it was difficult to identify the boundary between LCap and LC in upper cervical spine on MRI images, they were measured as a union muscle. The posterior muscles were trapezius (Trap), splenius capitis (SpCap), splenius cervicis (SpC), semispinalis capitis (SSCap), semispinalis cervicis (SSC), multifidus (MS) and levator scapulae (LS). Furthermore, the muscles posterior to the vertebra in deep layers, excluding the Trap, were also measured as a union muscle, and defined as posterior deep layer muscles (PDLM).
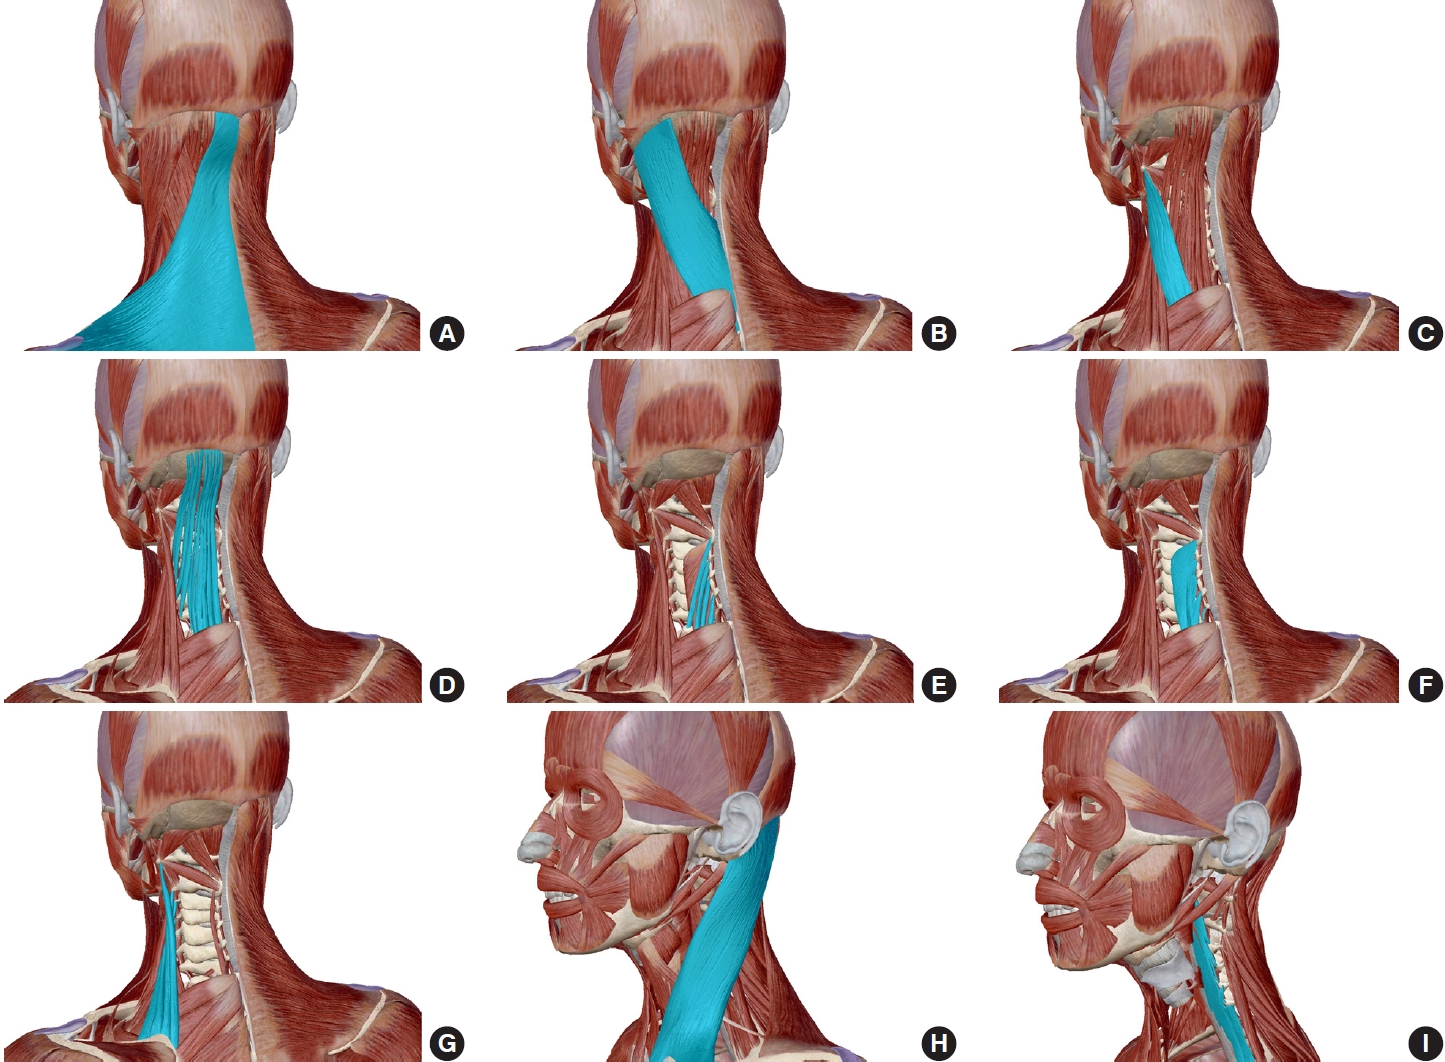
Schematic diagram of cervical muscles (from Atlas Anatomy Software, version 2021.0.16). (A) Trapezius. (B) Splenius capitis. (C) Splenius cervicis. (D) Semispinalis capitis. (E) Semispinalis cervicis. (F) Multifidus. (G) Levator scapulae. (H) Sternocleidomastoid. (I) Longus capitis and longus colli.

The T2 magnetic resonance images of cervical muscles. (A) Muscle boundary at C4/5 level on axial view. ① Trapezius, ② splenius capitis, ③ splenius cervicis, ④ semispinalis capitis, ⑤ semispinalis cervicis, ⑥ multifidus, ⑦ levator scapulae, ⑧ sternocleidomastoid, ⑨ longus capitis and longus colli, ⑩ posterior deep layer muscles. (B) Target levels by referring to the cervical intervertebral disc on midsagittal view. Representative images in control (C) and BI (D) groups. (C, D) Yellow ellipses represented sample region of interests for calibration.
The preoperative T2-weighted MRI images (Fig. 2) were captured and reconstructed via a 3.0T MRI scanner (Siemens Medical Solutions, Erlangen, Germany). Axial MRI images were aligned parallel to the inferior endplate of the vertebral body. Images on axial view at cervical disc level were used. Image on midsagittal view was used to determine the disc level. The muscle boundary was identified by referring to the cervical muscle atlas of healthy person [14]. The ImageJ software ver. 1.48 (National Institute Health, Bethesda, MD, USA) was used to measure the muscle size and functional muscle. Details have been reported elsewhere [15,16]. Briefly, the axial image was imported into the software, converted to 8-bit type, and reset at the proper scale. Then 4 to 6 ellipses were drawn on lean muscle as sample regions of interest (ROIs), carefully avoiding any visible pixel of fat. The maximum and minimum signal intensity values of sample ROIs were regarded as the highest and lowest thresholds of lean muscle, respectively. This calibration procedure was conducted for every cervical disc level of each subject to minimize measurement error. The cross-sectional area (CSA) of muscle was measured, and then the determined thresholds were applied to measure the lean muscle as functional cross-sectional area (FCSA). The ratio of FCSA to CSA (FCSA/CSA ratio) was further calculated. The mean CSA and FCSA/CSA ratio of all disc levels were calculated, respectively, for statistical analyses.
Additionally, the axial computed tomography (CT) image of BI patients were used to measure the atlantodental interval (ADI), distance between the posterior margin of anterior arch of C1 and the anterior margin of C2. The BI patients will be diagnosed with atlantoaxial dislocation if the ADI was greater than 3 mm in adults and greater than 5 mm in children [17]. The distance from the odontoid to Chamberlain line (line between hard palate and posterior margin of foramen magnum) in BI patients was also measured on sagittal CT image.
3. Statistical Analyses
IBM SPSS Statistics ver. 19.0 (IBM Co., Armonk, NY, USA) was used to conduct statistical analyses. Student t-test or Mann-Whitney U-test was used to compare the differences between groups. Pearson correlation test was used to analyze the correlations. The results were presented as mean± standard deviation and p< 0.05 indicated statistical difference.
4. Reliability Analyses
Regarding the cervical muscular CSA and FCSA/CSA ratio, both the intraobserver and interobserver reliability results showed good agreements (intraclass correlation coefficient [ICC]> 0.8).
RESULTS
1. Demography
Both BI and control groups contained 80 subjects (33 males, 47 females), with a mean age of 39.4± 18.4 years and 38.9± 17.4 years, respectively. Moreover, both BI and control groups consisted of 14 children, 26 young adults, 26 middle-aged adults and 14 older adults, respectively. In the BI group, there were 43 subjects with atlantoaxial dislocation (46.7± 14.6 years, 10 males, 33 females) and 37 subjects without (30.8± 18.9 years, 23 males, 14 females). Regarding the dislocation rate, the females (70.2%, 33 of 47) had a higher rate than males (30.3%, 10 of 33), while the adults (62.1%, 41 of 66) showed a higher rate than children (14.3%, 2 of 14).
2. Muscular Morphology in BI and Control Groups
Overall, the BI group exhibited significantly lower FCSA/CSA ratios than the control group, all p= 0.000 (Table 1). In children, only the FCSA/CSA ratios on the right SpCap and the left Trap were higher in the BI group than in the control group. In young adults, except for the FCSA/CSA ratio on the left SpC, the rest of the indicators were lower in the BI group than in the control group. In middle-aged and older adults, the FCSA/CSA ratios of all the muscles were lower in the BI group than in the control group.
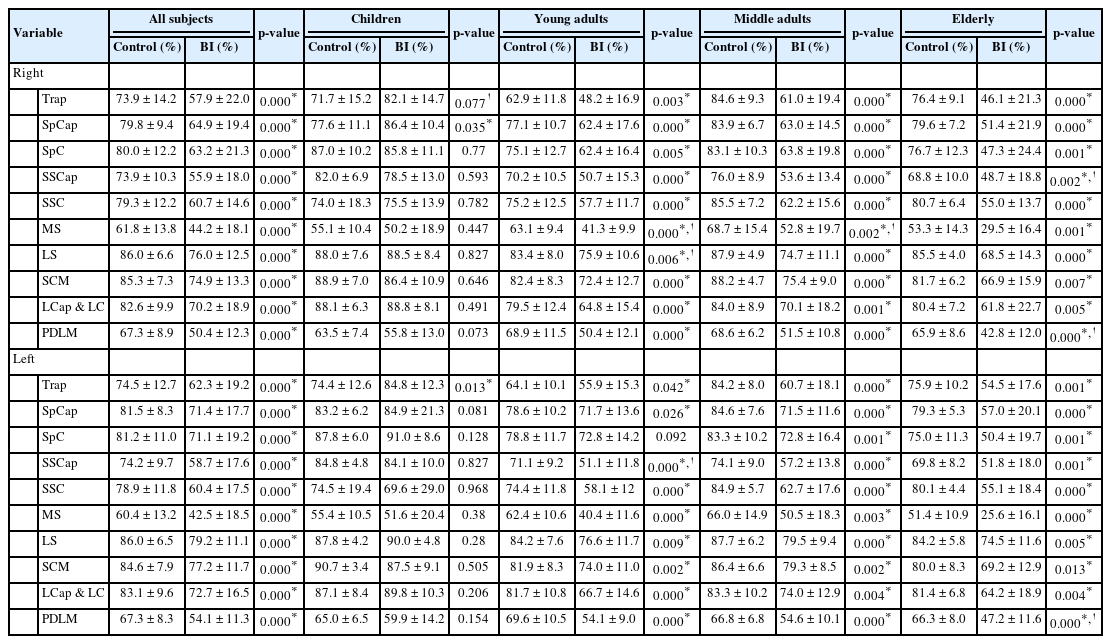
Comparisons of functional muscle between basilar invagination (BI) and control groups
As shown in Table 2, the BI group had smaller muscle sizes than the control group on the right and left Trap, SSC, LS, SCM, and left LCap & LC. However, the BI group had larger muscle sizes on the right SpCap and SSCap. In children, muscle size of the right MS was larger in BI group than in control group. In young adults, the BI group presented smaller muscle size on the right Trap, SpC, LS, SCM, and LCap & LC, left Trap, LS, SCM, and LCap & LC. In middle-aged adults, the BI group presented smaller muscle sizes on the right Trap, SSC and LS, left Trap, SSC, and LS, but larger muscle sizes on the right SpCap. In older adults, the BI group presented smaller muscle sizes on the right Trap and LS, but larger muscle sizes on the right and left MS.

Comparisons of muscle size between basilar invagination (BI) and control groups
3. Muscular Morphology in BI Patients With and Without Atlantoaxial Dislocation
As shown in Table 3, the BI patients with atlantoaxial dislocation had significant lower FCSA/CSA ratios on the right Trap, SpCap, SpC, SSCap, MS, LS, LCap & LC, and PDLM, and on the left SSCap, MS, and LCap & LC than the BI patients without dislocation. The dislocation population also tended to present lower FCSA/CSA ratios on the right SSC and SCM and the left Trap, SpCap, SpC, SSC, LS, SCM, and PDLM, without statistical significance.

Comparisons of functional muscle and muscle size between basilar invagination (BI) patients with and without atlantoaxial dislocation
The BI patients with atlantoaxial dislocation had significant smaller muscle sizes on the right and left PDLM. The dislocation population tended to present larger muscle sizes on the right and left Trap, SCM, and LCap & LC, but smaller muscle sizes on the right and left SpCap, SpC, SSCap, SSC, MS, and LS without significant difference.
4. Correlation Between Age and Muscular Morphology
For functional muscle, in control group, the age correlated negatively with FCSA/CSA ratios on the right SSCap, left SpC, SSCap, and SCM, but positively with FCSA/CSA ratios on the right Trap and SSC, left Trap and SSC. In BI group, the age correlated negatively with FCSA/CSA ratios on the right Trap, SpCap, SpC, SSCap, LS, SCM, LCap & LC, and PDLM, as well as on the left Trap, SpCap, SpC, SSCap, LS, SCM, LCap & LC, and PDLM (Table 4; Fig. 3A, B).

Correlations between age and muscular morphology in basilar invagination (BI) and control groups
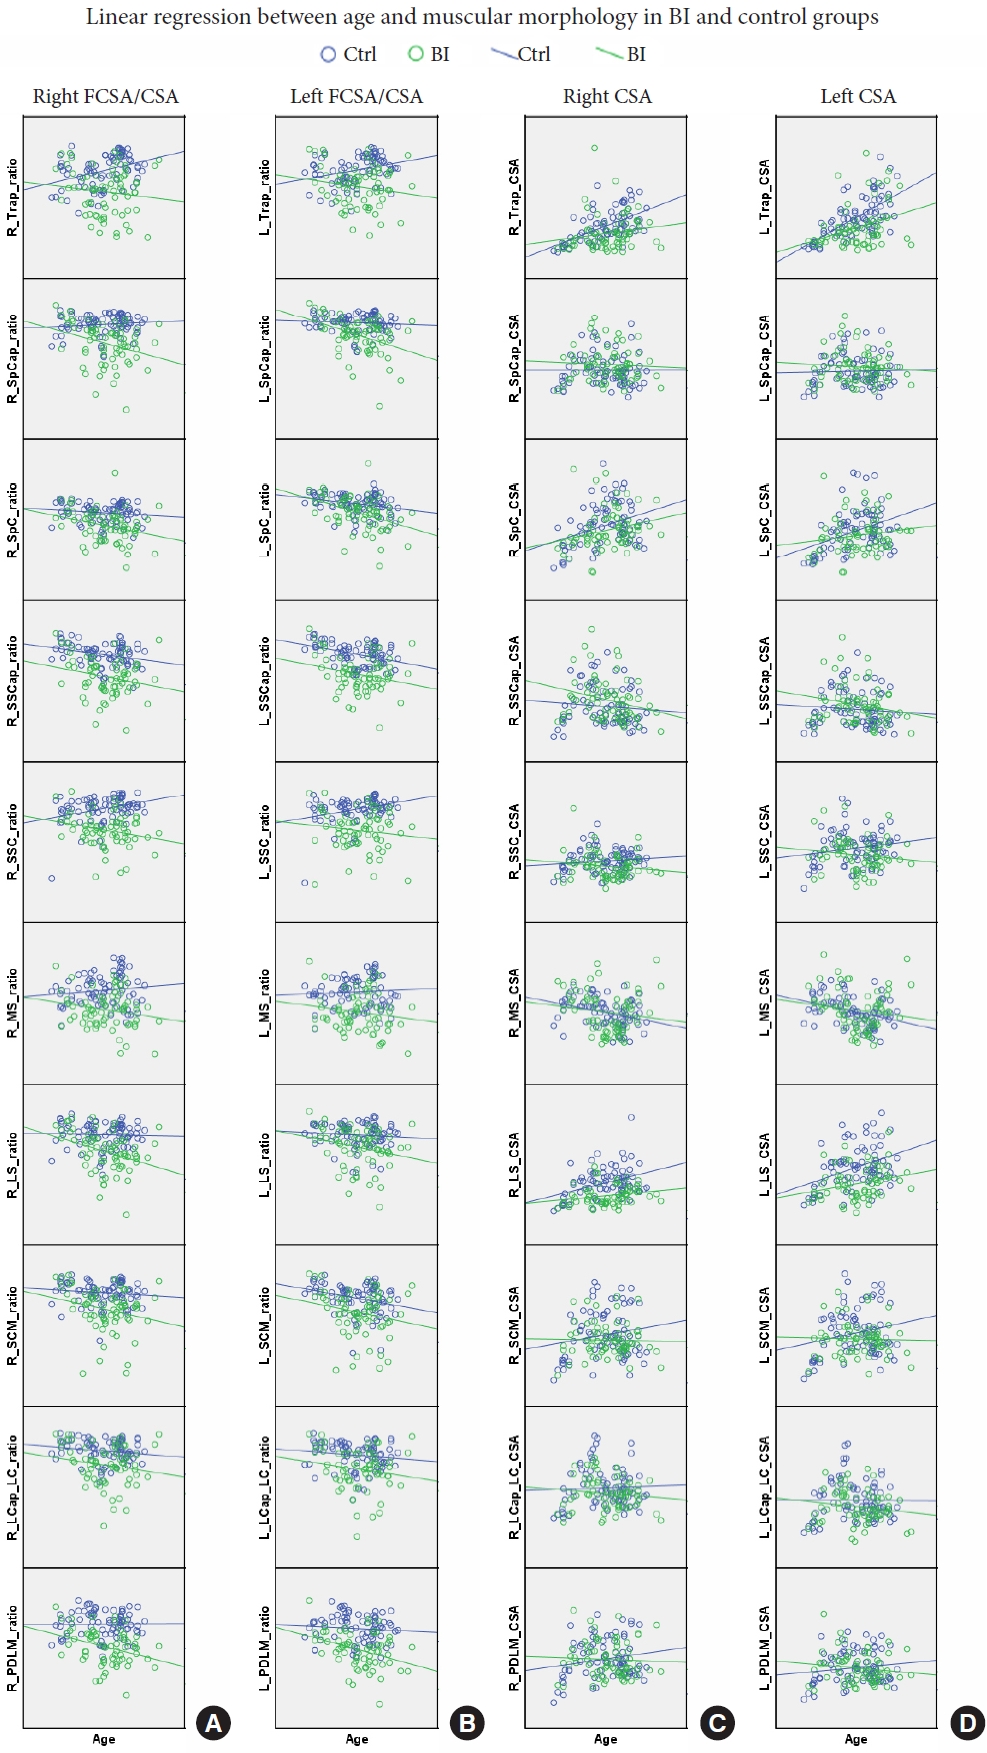
Panels A and B demonstrated the linear regression between age and FCSA/CSA ratio in right and left sides, respectively. Panels C and D demonstrated the linear regression between age and CSA in right and left sides, respectively. Blue circle and line indicated control group; green circle and line indicated BI group. CSA, cross-sectional area; FCSA, functional cross-sectional area; ratio, FCSA/CSA; L, right; R, right; Trap, trapezius; SpCap, splenius capitis; SpC, splenius cervicis; SSCap, semispinalis capitis; SSC, semispinalis cervicis; MS, multifidus; LS, levator scapulae; SCM, sternocleidomastoid; LCap_LC, longus capitis and longus colli; PDLM, posterior deep layer muscles.
For muscle size, in control group, the age correlated positively with muscle sizes on the right Trap, SpC, LS, and PDLM, and the left Trap, SpC, LS, and SCM, but negatively with muscle sizes on the right MS and the left MS. In BI group, the age correlated positively with muscle sizes on the right Trap, SpC, LS, SCM, and LCap & LC, the left Trap, SpC, and SCM (Table 4; Fig. 3C, D).
Excluding children, correlation between age and muscle sizes in adults alone are shown in Supplementary Table 1.
5. Correlation Between ADI, Chamberlain Distance, and Muscles in BI Patients
The ADI tended to correlate negatively with FCSA/CSA ratios on most of the target muscles without significant difference. The ADI also tended to correlate negatively with muscle sizes on most of the target muscles, especially on the right and left SSCap and PDLM.
The Chamberlain distance tended to present negative correlation with the FCSA/CSA ratios but tended to show positive correlation with the muscle sizes on most of the target muscles. However, no significant difference was observed.
Details are shown in Supplementary Table 2 and 3.
DISCUSSION
This is the first research to investigate the cervical muscle morphology in BI patients by comparing with the age- and sex-matched asymptomatic people. The effects of atlantoaxial dislocation on muscles were also firstly explored in this study.
To summarize, less functional muscles were presented in all anterior and posterior and superficial and deep layer muscles in young adults, middle-aged adults and the elderly with BI, but not in children. Additionally, the BI patients mainly presented smaller muscles sizes on the Trap, SSC, LS, SCM, and LCap & LC, but larger muscle sizes on the SpCap and SSCap. Moreover, BI patients with atlantoaxial dislocation tended to have less functional muscles in all parameters, especially on the Trap, SpCap, SpC, SSCap, MS, LS, LCap & LC, and PDLM, than those without dislocation. The muscle sizes of parameters were similar between BI patients with and without dislocation, but the muscle size of PDLM was smaller in dislocation population. Furthermore, the functional muscles of all target muscles decreased with age in BI patients, which was more obvious than in the control group. Interestingly, the ADI tended to correlate negatively with both FCSA/CSA ratio and CSA of most parameters, while the Chamberlain distance tended to correlate negatively with FCSA/CSA ratio but positively with CSA of most parameters.
1. Excessive Use Caused Muscle Fatigue and Dysfunction
One of the biomechanical roles of cervical musculoskeletal function is to maintain the stability of head and cervical spine. The excessive use of muscle would cause muscle fatigue and even dysfunction. Due to the prolapse of odontoid into the foramen magnum, the medulla oblongata and spinal cord are compressed which result in neural symptoms in BI patients. The BI patient was found to present a stiffer neck [6]. We deduced that the BI patient needed to maintain their cervical spine in a certain posture to reduce discomfort. Therefore, compared to control group, BI patients’ muscle function was extensively affected, involving all cervical muscle groups, after long-term intensive posture. Meanwhile, such change was progressive, as the FCSA/CSA ratio decreased with age but was not obvious in children.
In addition, on the one hand, the BI patients with atlantoaxial dislocation had more severe cervical instability than those without dislocation, so that they needed to make more effort to maintain the CVJ region at neutral and relatively normal position and their muscular malfunction was more obvious. On the other hand, larger ADI and Chamberlain distance indicated more severe malformation in CVJ region, accompanied with more severe compression. Thus, to resist against the compression, muscular overuse might be more common in BI patients with larger ADI and Chamberlain distance. The ADI and Chamberlain distance represented the degree of compression and thus correlated negatively with functional muscle.
As an adaptive organ, muscle might initially develop compensatory hypertrophy to partially compensate for loss of muscle function. It explained the lack of obvious differences in both muscle function and size between BI and control groups in children. Additionally, the muscle size also positively correlated with Chamberlain distance, suggesting that it was a compensatory change to offset the loss of function.
2. Muscle Size and Function decreased in Patients With Malformation
To the best of our knowledge, the muscle morphology in BI patients had been rarely reported so far. Thakar et al. [18] investigated the cervical paraspinal muscles in 25 patients with Chiari I malformation, a common complication of BI, and found that the dimension of cervical paraspinal muscles including superficial, deep flexor and extensor were smaller than that of the control group. The authors calibrated the muscle CSA with vertebra body CSA to eliminate biases in body size so that we could not directly compare our muscle CAS results with theirs. However, we observed the same tendency that the CSA of Trap, SSC, LS, SCM, and LCap & LC were smaller in BI patients. Moreover, we supposed that the FCSA/CSA ratio was more meaningful than muscle size, but it was absent in the study of Thakar et al. [18].
BI is a kind of bony malformation in CVJ region. There are few studies about muscle function in patients with cervical deformity. Passias et al. [7] measured the cervical extensor musculature, which consisted of 5 separate muscles, in patients with cervical deformity. The mean FCSA/TCSA ratio were 0.58 at baseline and 0.67 at first year post-operation in their study, while the FCSA/CSA ratio of PDLM were 52.22% in BI group and 67.32% in control group (average right and left sides) in ours. Their baseline data were similar to those of BI patients in our study. Meanwhile, although they did not measure muscle parameters in normal people, and the data of FCSA/TCSA ratio at first year post-operation were quite similar to those of control group in our study. This indicated a good agreement of muscle morphology between cervical deformity and BI patients. Passias et al. [7] included both alignment and clinical symptoms in their study, and well associated these factors with muscle function. However, the sample size was too small (only 22 cases) comparing to ours (160 cases). Moreover, we identified the main extensor and flexor muscles and quantified each result, respectively, while Passias et al. [7] measured 5 main extensor muscles as a union. Our research was the first study that measure the muscles separately as many as possible.
Another study from Passias et al. [19] showed that patients with cervical deformity illustrated apparent fatty infiltration alterations in the posterior extensor musculature of the cervical spine, especially in the upper cervical spine. They also recommended that fatty infiltration as a predictor of postoperative sagittal alignment. The FCSA/TCSA ratio was 0.65 in the patients with cervical deformity, higher than that of PDLM in BI group (52.22%) but lower than the control group (67.32%) in our study. The difference may be due to different bone abnormality.
3. BI Is Not the Only Factors That Cause Abnormal Muscular Morphology
The abnormal morphology of muscle in BI patients could be resulted from various factors, such as age, muscular or bony malformation, or degenerative diseases. However, we believe that BI itself is the primary bony malformation and intrinsic cause of changes in muscular morphology.
A control group with age- and sex-matched subjects was used as comparison to BI group in this study. And for both groups, we excluded subjects with cervical spondylosis intervertebral disc herniation, or other severe degenerative diseases that were known to affect muscle size or function. These factors which might cause bias were eliminated as best as we could. Hence, although the degenerative changes etc. were not listed as independent variables, our data well supported the conclusion in this study.
Moreover, the present study mainly aimed to demonstrated the differences in muscle size and functional muscle between BI patients and control subjects basing radiological data. We agree that BI itself and related deformities on CVJ region are contributing factors. We did not systematically analyze the potential causes in current work. This is an interesting theme and we will collect more detailed patient data for further analyses in future study.
4. BI Patients Were Recommended to Take Early Exercise on Muscle
So far, most studies reported that the cervical/lumbar muscle were correlated with cervical/lumbar alignment (e.g., sagittal vertical axis) and clinical outcomes, such as visual analogue score and Neck Disability Index scores [7,10,11,18,20]. Yoon et al. [8] investigated the ratio of flexor to extensor muscle CSAs and found that it positively correlated with the cervical lordotic angle, recommending exercise programs to strengthen the extensor muscles. A randomized controlled trial proved that, in addition to conventional exercises, specific training of deep cervical flexor muscles could help subjects improve muscle endurance, pain, and disability [21]. A pilot study reported that after 10-week systematic training on cervical muscles, the chronic whiplash patients presented significant increase in muscle size (MS and LCap & LC) and decrease in fatty infiltration (MS), with recovery of muscle strength and reduction of neck disability [22].
The literature affirms the effect of cervical muscle training on cervical spine stability and muscle function. In the present study, the results indicated that functional muscles were less in BI patients and decreased with age with more obvious trends than control group. Furthermore, our previous study also revealed that BI patients presented the loss of cervical curvature [6]. Therefore, early exercise on both cervical extensor and flexor muscles is necessary to alleviate fatty infiltration and strengthen muscle function. The cervical muscle training may even prevent BI patients from the exacerbation of clinical symptom as aging, because early intervention would provide BI patients better muscle strength, prevent the occurrence of atlantoaxial dislocation, and stop the progression of neural compression. With efficient muscle training, the BI patients may not require surgical treatment in the future.
5. Thresholding Technique to Qualify Muscle Function on MRI Images
The thresholding technique to measure the functional muscle by detecting the lean muscle has been well validated in the Fortin and Battié [15] in many published papers. The ICCs of ImageJ software varied between 0.78 and 0.99 in most muscular indicators, and excellent agreement was shown between muscle composition measurements using ImageJ and another software (inter-software ICCs: 0.81–0.99). Furthermore, a study investigated the inter- and intrarater reliability of a novice and an experienced rater, finding that (1) the intrarater ICCs varied between 0.84 and 0.99 for the novice rater, and varied between 0.94 and 0.99 for the experienced rater in all measurements of CSA and FCSA (2) the interrater ICCs varied between 0.75 and 0.98 in CSA measurements, and varied between 0.60 and 0.77 in FCSA measurements [23]. This method has been applied to assess the association between cervical muscle morphology and clinical outcomes in patients with degenerative cervical myelopathy [10,16]. Hence, we believe the thresholding technique method is reliable and repeatable.
Some researchers indirectly estimated the muscle function by measuring the area of fat infiltration (FIA) and then calculating the FIA/CSA ratio [24], or further calculating FCSA/CSA ratio= 1–FIA/CSA ratio [25,26], in which they set up a threshold for fat and used this value for all measurements. However, this method lacked a calibration step. In this study, we measured the functional muscle directly, and the procedure contained a step of calibration for each slice and each subject. It helped to reduce the inter-individual and inter-slice difference, so that we believed our results were more reliable.
There are limitations in this study. Firstly, we did not include clinical outcome indicators. This was a retrospective study, and many BI patients were outpatients. It was difficult to collect all the information. It would be better to design a prospective study in the future. Secondly, it is preferable to normalize the muscle size with the CSA of intervertebral disc. However, we found that it was hard to recognize the margin of disc in some cases, which made it difficult to accurately measure the CSA of disc. Hence, we had to dismiss these data and skip the normalization.
CONCLUSION
The BI patients, especially those with atlantoaxial dislocation, had less functional muscles compared with the control group. Moreover, the functional muscles of most parameters decreased with age and tended to negatively correlate with ADI and Chamberlain distance. It would benefit the BI patients to take early muscle exercise. Our findings may have important implications for developing the knowledge of the association between cervical muscle and BI.
Supplementary Material
Supplementary Tables 1-3 can be found via https://doi.org/10.14245/ns.2346302.151.
Correlations between age and muscle size (CSA) in BI and control groups (adults only)
Correlations between ADI and parameters in BI groups
Correlations between Chamberlain distance and parameters in BI groups
Notes
Conflict of Interest
The authors have nothing to disclose.
Funding/Support
This study was sponsored by the National Natural Science Foundation of China (No. 82172523 and No. 81972110), and the Natural Science Foundation of Guangdong Province (No. 2022A1515010488).
Author Contribution
Conceptualization: JL, WJ; Data curation: JL, PX, JZ, ZZ, JT, HX, WJ; Formal analysis: JL, PX, SY; Funding acquisition: QZ, WJ; Methodology: JL, PX, JZ, ZZ, JT, HX; Project administration: QZ, WJ; Writing - original draft: JL, PX; Writing - review & editing: WJ.