Outcomes of Surgical Treatment for Patients With Mild Scoliosis and Age-Appropriate Sagittal Alignment With Minimum 2-Year Follow-up
Article information
 , Justin S. Smith2, Peter G. Passias3, Han Jo Kim4, Shay Bess5, Douglas C. Burton6, Eric O. Klineberg7, Virginie Lafage8, Munish Gupta9, Christopher P. Ames1, The International Spine Study Group
Abstract
Objective
The goal of this study was to determine if patients with mild scoliosis and age-appropriate sagittal alignment have favorable outcomes following surgical correction.
Methods
Retrospective review of a prospective, multicenter adult spinal deformity database. Inclusion criteria: operative patients age ≥18 years, and preoperative pelvic tilt, mismatch between pelvic incidence and lumbar lordosis (PI–LL), and C7 sagittal vertical axis all within established age-adjusted thresholds with minimum 2-year follow-up. Health-related quality of life (HRQoL) scores: Oswestry Disability Index (ODI), 36-item Short Form health survey (SF-36), Scoliosis Research Society-22R (SRS22R), back/leg pain Numerical Rating Scale and minimum clinically important difference (MCID)/substantial clinical benefit (SCB). Two-year and preoperative HRQoL radiographic data were compared. Patients with mild scoliosis (Mild Scoli, Max coronal Cobb 10°–30°) were compared to those with larger curves (Scoli).
Results
One hundred fifty-one patients included from 667 operative patients (82.8% women; average age, 56.4 ± 16.2 years). Forty-two patients (27.8%) included in Mild Scoli group. Mild Scoli group had significantly worse baseline leg pain, ODI, and physical composite scores (p < 0.02). Mean 2-year maximum coronal Cobb angle was significantly improved compared to baseline (p < 0.001). All 2-year HRQoL measures were significantly improved compared to (p < 0.001) except mental composite score, SRS activity and SRS mental for the Mild Scoli group (p > 0.05). From the mild Scoli group, 36%–74% met either MCID or SCB for the HRQoL measures. Sixty-four point three percent had minimum 1 complication, 28.6% had a major complication, 35.7% had reoperation.
Conclusion
Mild scoliosis patients with age-appropriate sagittal alignment benefit from surgical correction, decompression, and stabilization at 2 years postoperative despite having a high complication rate.
INTRODUCTION
Typically adult spinal deformity (ASD) patients present with reduced quality of life, disability, and pain [1-3]. It has been well established that surgical management of these patients can provide significant improvements in their presenting symptoms as well as an increase in their spine-specific and overall health-related quality of life (HRQoL) [4-10]. However, these surgeries are technically challenging and are associated with a high complication rate ranging from 14%–71% [11-13]. As a result, there have been many studies attempting to identify ASD patients that will benefit from surgery, including evaluating the major factors associated with the relationship between HRQoL and alignment in these patients.
The primary driver of poor HRQoL and disability in patients with ASD has been shown to be sagittal spino-pelvic malalignment, specifically global sagittal vertical axis (SVA), pelvic tilt (PT) and the mismatch between pelvic incidence and lumbar lordosis (PI–LL) [9,14-18]. These findings have been corroborated by many studies over the past 10 to 15 years beginning with the landmark studies by Glassman et al. [16,17] that demonstrated the relationship between SVA and HRQoL. More recently, it has been determined that the sagittal malalignment thresholds for which a patient experiences disability varies by age [19-24]. As patients age, they are able to tolerate a larger sagittal malalignment before reaching significant disability and thus correction to the prior sagittal alignment thresholds may result in unnecessary overcorrection [24]. The association between sagittal alignment and HRQoL has been very well validated over the years and studies have tried to determine if coronal correction alone results in HRQoL improvement. A study by Daubs et al. [25] investigated preoperative coronal imbalance and HRQoL showing that correction of the coronal curve alone was not a factor for predicting improved functional outcomes and that sagittal malalignment was the strongest predictor. Furthermore, Buell et al. [26] studied ASD patients with severe coronal curves of greater than 75° and found that patients had significant improvement in HRQoL. However these patients also had correction in the sagittal plane making it more difficult to isolate the effect of the coronal curve correction on HRQoL.
Based on our clinical experience, there exists a small population of ASD patients with minor coronal curves who are within their respective age-appropriate sagittal alignment parameters. Yet these patients still present with poor HRQoL, which may be from compression of neural elements and mechanical instability from degenerative changes given the small curves. It is unclear how these patients may do following surgical correction and the management of such patients remains to be delineated [27]. To our knowledge, a study has yet to be conducted for these specific ASD patients. The importance of a study evaluating the surgical outcomes of this specific population of patients is that the results can aid in better decision making between the surgeons and patients as well as allow for the basis to study this population in a prospective nature. The objective was to identify the patients with both age-appropriate baseline sagittal alignment and mild coronal malalignment and then to characterize their outcomes following deformity surgery compared to patients with larger coronal curves.
MATERIALS AND METHODS
1. Patient Population
This study is a retrospective review of a prospective multicenter ASD database, which is contributed to by 13 sites across the United States. All patients were consecutively enrolled into a protocol for which each site obtained Institutional Review Board approval. Patient data was then prospectively collected and entered into the database. Inclusion criteria for the database were: age ≥ 18 years and presence of spinal deformity, as defined by one or more of the following: scoliosis Cobb angle ≥ 20°, SVA ≥ 5 cm, PT ≥ 25°, and/or thoracic kyphosis (TK) ≥ 60°. Exclusion criteria included spinal deformity of a neuromuscular etiology and presence of active infection or malignancy. In addition to the above database inclusion criteria, study patients were included if they had preoperative age-appropriate measurements for SVA, PT, and PI–LL [19,24,28,29]. The method for determining patients age-appropriate sagittal alignment thresholds has been described in the literature [19-24,28,29], however, in brief, specific equations were developed in a prior study by Lafage et al. [21] to predict a patient’s sagittal alignment threshold based on their age-adjusted Oswestry Disability Index (ODI) scores from population norms. Using those equations, the authors then calculated an age-adjusted sagittal alignment threshold for severe disability as defined by an ODI score of 40. Using those predetermined age-adjusted alignment thresholds for SVA, PT, and PI–LL, each patient in the present study was compared to those predetermined thresholds and if all 3 alignment parameters were below the established age-adjusted thresholds in the prior study, those patients were included in the present study. And of those, patients with mild scoliosis as defined by a maximum coronal Cobb angle of 10°–30° were also selected (Mild Scoli) and compared to the other scoliosis patients with larger curves (Scoli). The mild scoliosis definition was a consensus among multiple fellowship trained ASD surgeons and this range has also been used in the pediatric population [30-33].
2. Data Collection: Demographics, Radiographic Assessment, HRQoL, and Surgical data
The demographic and clinical data collected included patient age, sex, body mass index (BMI), number and type of comorbidities, and Charlson Comorbidity Index [34]. Surgical data collected included: whether the index surgery was a primary or revision procedure, whether the surgery was an anterior or posterior fusion (and number of levels for each), the presence of a 3-column osteotomy (vertebral column resection or pedicle subtraction osteotomy), the uppermost instrumented vertebra (UIV), the lowermost instrumented vertebra, the number of posterior levels fused, and the ASD surgical invasiveness score [35]. The presence of and the number of levels were also collected for the following: direct decompression, Smith-Petersen osteotomies (SPO), and interbody fusion (IBF). The surgical indications and decision to pursue surgery was left up to the discretion of the individual surgeon and their discussion with the patient.
Full-length free-standing lateral spine radiographs (36” cassette) at baseline were analyzed using validated software [36] (Spineview, ENSAM, Laboratory of Biomechanics, Paris, France). All radiographic measures were performed at a central location based on standard techniques [36] and included: coronal Cobb angles of thoracic and lumbar curves, maximum coronal Cobb angle, coronal plumbline (C7–S1), TK (T4–12; Cobb angle between superior endplate of T4 and inferior endplate of T12), LL (Cobb angle between superior endplate of L1 and superior endplate of S1), SVA (C7 plumbline relative to S1), PT, and PI–LL. The SRS-Schwab coronal curve type and sagittal modifiers were determined for all patients [37]. And lastly, all patients were categorized based on previously published age-adjusted thresholds for PT, PI–LL, and SVA [19-24,28,29]. Patients were required to have all 3 sagittal parameters within their respective age-adjusted thresholds to be included in the study.
Standardized HRQoL measures included the ODI, 36-item Short Form health survey (SF-36), and Scoliosis Research Society-22R (SRS-22R). Two standard summary scores were calculated based on the SF-36, the physical composite score (PCS) and the mental composite score (MCS). Furthermore, each patient was classified according to the ASD frailty index [38,39]. The SRS-22R provides a total score and multiple subdomains, including activity, pain, appearance, mental, and satisfaction. A Numerical Rating Scale (NRS) score ranging from 0 (no pain) to 10 (most unbearable pain) was collected for back and leg pain separately. In order to place HRQoL outcomes in a clinically relevant context, minimal clinically import difference (MCID) values have been established for the HRQoL instruments [37,40]. The proportions of patients reaching MCID for each HRQoL measure were also considered. Substantial clinical benefit (SCB) values for ODI, PCS and back and leg pain NRS have also been established [40]. The MCID/SCB values used in the present study included: ODI (-16/-18.8), PCS (+5.2/+6.2), back and leg pain NRS (-2/-3) [37,40-42].
3. Statistics
Continuous variables were described with the mean and standard deviation (SD). Baseline and 2-year variables were compared. Normality of data was determined using the Shapiro-Wilk test. Comparison of baseline means between the groups initially included an analysis of variance or Kruskal-Wallis test when appropriate, which was followed by pairwise comparisons using Tukey honest significant difference test to control for type I error or Wilcoxon rank-sum tests where appropriate. Frequency analyses for categorical variables were conducted via Pearson χ2 analysis. All statistical analyses were conducted using commercially available software (IBM SPSS Statistics ver. 22.0, IBM Co., Armonk, NY, USA) and the level of significance was set at p< 0.05 for all tests.
RESULTS
A total of 667 operative patients were eligible for inclusion and of those, 151 patients (22.6%) met these additional inclusion criteria (82.8% female; mean age, 56.4 ± 16.2 years). The mean BMI was 25.3± 4.9 kg/m2. Of the 151 patients included, 42 of those (27.8%) met the additional inclusion criteria of having a maximum coronal Cobb angle of 10°–30° (Mild Scoli). Of the 42 Mild Scoli patients, 3 (7.1%) had their maximum coronal curve in thoracic spine, 13 (31.0%) in the thoracolumbar region and 26 (61.9%) in the lumbar spine. Only 27 study patients (17.9%) had a prior fusion. The rates of medical comorbidities for the Mild Scoli group ranged from 0%–52.4% (Table 1). The Mild Scoli group had a significantly higher preop frailty score, a higher distribution of number of comorbidities, higher rate of arthritis, and diabetes (p< 0.05 for all, Table 1). Most of the Mild Scoli patients underwent a posterior-only fusion (76.2%) with mean number of levels fused being 10.9± 4.2. Only 4.8% had a 3-column osteotomy and a over half (61.9%) underwent at least one IBF (Table 2). The Mild Scoli patients had a significantly lower surgical invasiveness score and mean number of posterior levels fused (p< 0.05 for both) (Table 2). The Mild Scoli group had a significantly higher percentage of patients with UIV in the thoracic and lumbar spine (p< 0.05). And lastly, the Mild Scoli group had a significantly higher rate of patients that received a direct decompression and higher mean number of levels decompressed with a significantly lower mean number of levels with an SPOs (p< 0.05 for all) (Table 2).

Complete list of patient comorbidities
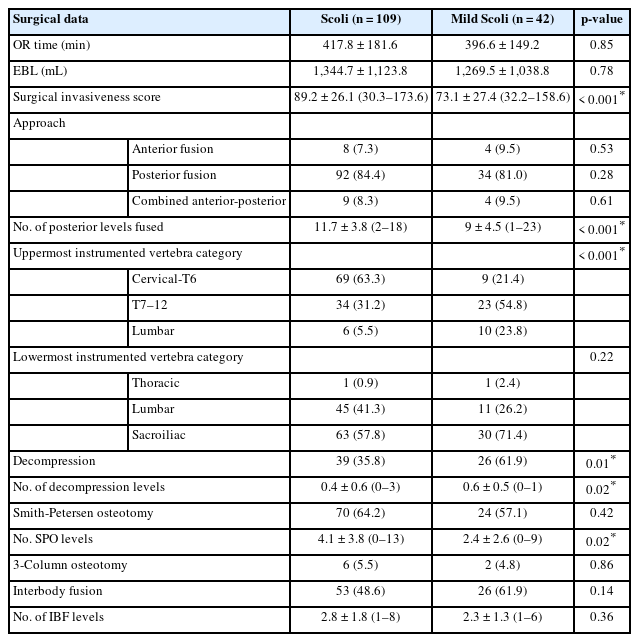
Surgical data for both Scoli and Mild Scoli patients
The 2-year postoperative mean maximum coronal Cobb angles were significantly reduced in the Mild Scoli group compared with baseline with a mean decrease of 8.8° ± 6.6° (p < 0.001) (Table 3). The Scoli group had a similar significant reduction in Max coronal Cobb angle of 29.9°± 14.4° (p< 0.001). However, the coronal C7 plumb line change was not significantly different for both groups (p> 0.05 for both). There were no significant changes in the sagittal alignment measures for SVA, PT, and PI–LL for both groups. However, the TK significantly increased at 2 years postoperative for the Scoli group by a mean of 4.8°± 16.3° (p= 0.006) (Table 3). Of the 101 patients that had an increase in TK, 17 developed proximal junctional kyphosis (PJK) within the 2-year postoperative period for an overall rate of 11.3%.
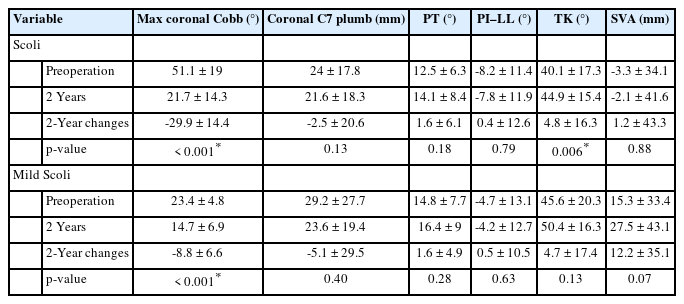
Mean±standard deviation for the preoperative, 2 years, and 2-year differences compared with preoperative values radiographic parameters for both the Scoli cohort and the Mild Scoli group
All 2-year HRQoL measures were significantly improved compared to baseline for the Scoli group (p< 0.001) (Table 4). For the Mild Scoli group, all HRQoL measures were significantly improved at 2 years postoperative (p < 0.002) with the exception of MCS, SRS activity, and SRS mental (p> 0.05 for all 3). Compared with the Scoli group, the Mild Scoli group had a significantly worse baseline leg pain (5.2±3.3 vs. 3.5±3.3, p=0.008), ODI (44.3 ± 14.7 vs. 36.6 ± 18.3, p = 0.012), and PCS (31 ± 8.5 vs. 36.2± 10.9, p= 0.011) scores. For the Mild Scoli group, many patients either met MCID or SCB at 2-year follow-up (36%–74%, Fig. 1). The greatest percentage of Mild Scoli patients that met MCID was for SRS pain, and back pain NRS with both rates being 74% (Fig. 1). All MCID and SCB rates were not statistically different between the Scoli and Mild Scoli groups with the exception of SRS Appearance MCID; the Mild Scoli group had a significantly lower rate of patients meeting MCID (Fig. 1).

Health-related quality of life measures for Scoli patients and the Mild Scoli patients at preoperative and 2-year times points with 2-year differences compared with preoperative values
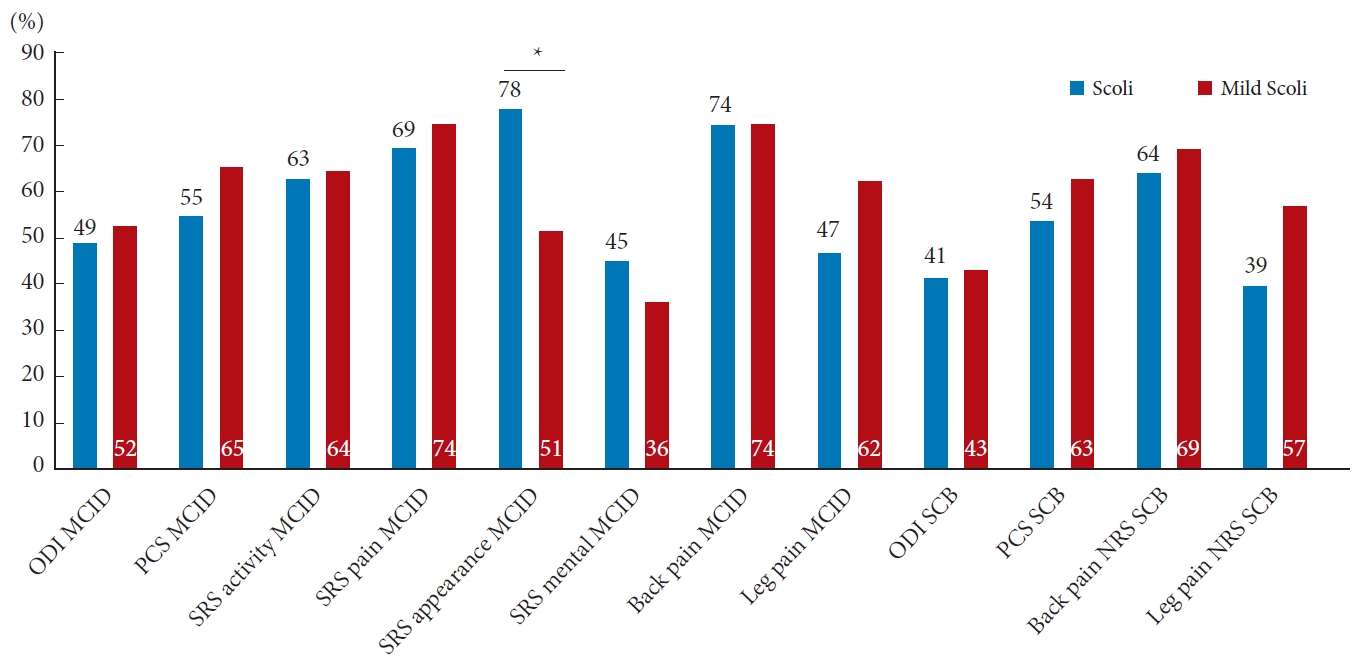
The percentage of patients that reached minimal clinically important difference (MCID) and significant clinical benefit (SCB) from baseline to 2 years postoperative for the Scoli and Mild Scoli groups. Scoli, patients with larger curves (greater than 30°); Mild Scoli, patients with mild scoliosis (10°–30°); ODI, Oswestry Disability Index; PCS, physical composite score of the medical Short Form 36 (SF-36); MCS, mental composite score of the SF-36; SRS, Scoliosis Research Society-22 questionnaire; NRS, Numerical Rating Scale. *p<0.05, statistically significant differences.
There was a high complication rate within both groups. For the Mild Scoli patients, 64.3% had at least 1 complication with 28.6% having at least one major complication and 35.7% requiring a reoperation (Table 5). The indications for reoperation were the following (note: does not add up to total of 15 patients as some patients had multiple complications): Gastrointestinal: 1, painful/prominent implants: 2, rod fracture: 1, loose screw/medial breach: 3, wound infection: 1, epidural hematoma: 1, motor deficit/spinal cord injury: 2, cerebrospinal fluid leak: 1, visceral injury: 1, wound incisional hernia: 1, and PJK: 3. The most common type of complication was implant related at 28.6% with the second and third most common being neurologic (23.8%) and radiographic (21.4%, Table 5). Of the implant complications, the subcategories were the following: Loose implant: 4, painful/ prominent implant: 2, rod/screw fracture: 3, and medial screw breach: 3. Of the neurologic complications, the subcategories were the following (note: does not add up to total of 15 patients as some patients had multiple complications): Epidural hematoma: 1, mental status changes: 2, motor deficit: 3, radiculopathy: 3, spinal cord injury: 1, sensory deficit: 1, and stroke: 1. Of the radiographic complications, the subcategories were the following: postop sagittal malalignment: 1, and PJK: 8. There were no statistically significant differences in complication rates between Scoli and Mild Scoli groups (p> 0.05 for all) (Table 5).
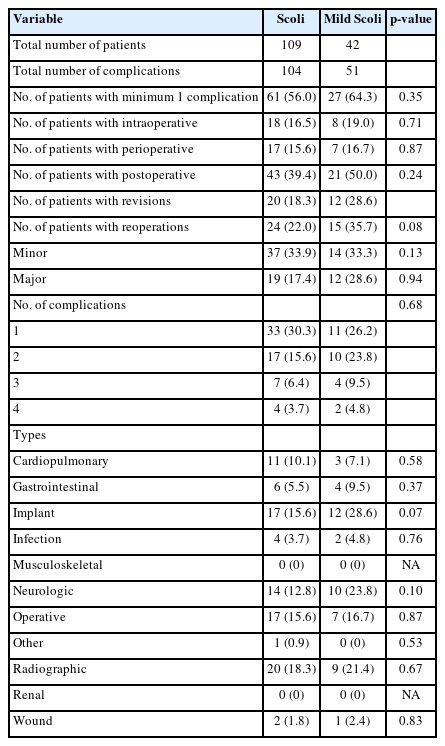
Distribution of complication number and types for the Scoli and Mild Scoli groups
Case example: The patient is a 75-year-old woman with mild scoliosis (Fig. 2) and baseline HRQoL scores of the following: back pain NRS: 8, leg pain NRS: 9, ODI: 56, PCS: 17.4, SRS activity: 1.75, pain: 1.2, appearance: 3.4, mental: 4, and satisfaction: 3.5. She underwent a T11-pelvis posterior instrumented fusion with significant correction of her lumbar scoliosis (Fig. 3). She had 1 major operative complication requiring a reoperation. Despite this, at 2 years postoperative she met MCID and SCB for all HRQoL measures except the SRS mental score.
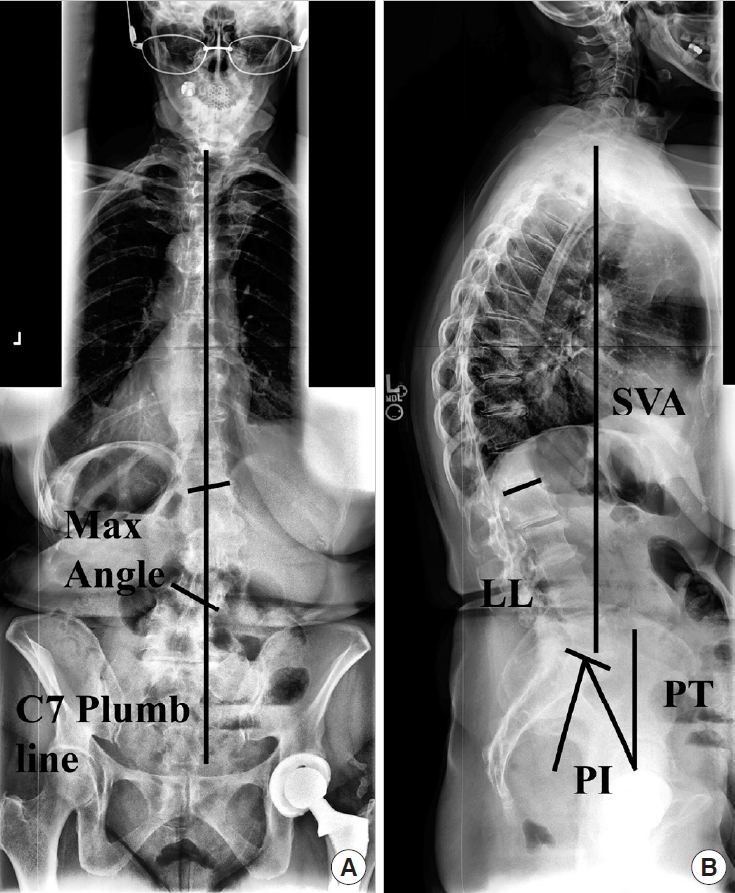
Case example. Preoperative anteroposterior (A) and lateral (B) radiographs demonstrating the coronal and sagittal spinal alignment parameters. The vertical line in the left image represents the coronal C7-plumb line (3.2 cm) and the Max coronal Cobb angle was 28.3°. SVA, sagittal vertical axis (2.9 cm); PI, pelvic incidence; LL, lumbar lordosis (PI–LL=4.0°); PT, pelvic tilt (22.6°).
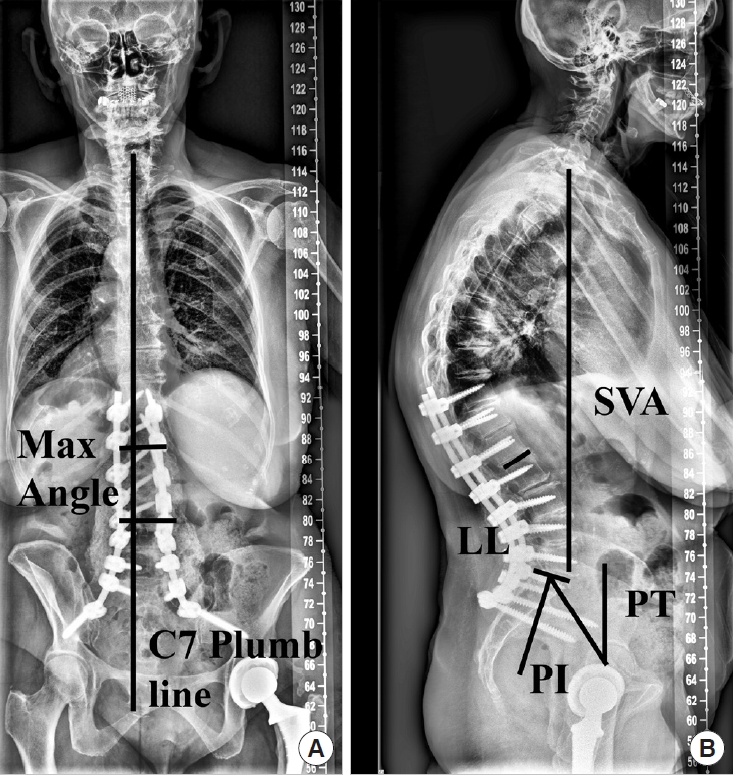
Case example. Two-year postoperative anteroposterior (A) and lateral (B) radiographs demonstrating the coronal and sagittal spinal alignment parameters. The vertical line in the left image represents the coronal C7-plumb line (1.4 cm) and the corrected Max coronal Cobb angle was 7.3°. SVA, sagittal vertical axis (3.0 cm); PI, pelvic incidence; LL, lumbar lordosis (PI–LL=-5.8°); PT, pelvic tilt (24.4°).
DISCUSSION
It is now common knowledge amongst spine surgeons and evidenced throughout the literature that sagittal spinopelvic alignment is associated with patient reported HRQoL scores and that surgical correction of sagittal malalignment results in significantly improved function and quality of life. However, there exists a small population of ASD patients with mild scoliosis and sagittal alignment parameters within the age-appropriate thresholds who still present with significant disability and poor HRQoL. This is the first study of its kind investigating the 2-year surgical outcomes of such patients and demonstrated that symptomatic patients with only coronal deformities do well both radiographically and by HRQoL measures. More specifically, patients with mild scoliosis as defined by a maximum coronal curve of 10°–30° and with age-appropriate sagittal spinopelvic parameters have significant improvements in 2-year radiographic and HRQoL outcomes. The Mild Scoli patients are more frailer with a higher number of comorbidities and higher rates of arthritis and diabetes. The Mild Scoli patients had worse baseline leg pain, ODI, and PCS scores and underwent a less invasive surgery (less mean number of posterior fusion levels and SPOs) with a higher rate of direct decompressions. The mean Max coronal Cobb angle of the Mild Scoli patients was improved postoperatively and many patients met MCID or SCB despite having a relatively high overall complication rate of 64.3% and 28.6% for a major complication that was not different that the Scoli group.
The concept of age-appropriate sagittal alignment is a relatively new idea in ASD and refers to the notion that as one ages, there tends to be a tolerance for a larger sagittal malalignment for a given level of disability. The study by Lafage et al. [21] investigated this concept and defined new radiographic thresholds for surgical correction of sagittal malalignment based on age. They evaluated 773 ASD patients and their baseline HRQoL. Then, based on published PCS norms for a given age group, they created a regression analysis for PCS and ODI using severe disability as defined by an ODI of 40 to calculate the new age-adjusted thresholds for sagittal alignment [21]. This is the same technique employed in the original study by Schwab et al. [43] that defined the prior sagittal alignment thresholds for SVA, PT, and PI–LL. The concept of age-appropriate sagittal alignment has been expanded upon over the last few years [19,20,22-24,29]. Specifically, there appears to be no benefit to overcorrecting patients based on their age-appropriate thresholds [24] and furthermore, correction to age-appropriate alignment may reduce the incidence of PJK [22]. Therefore, when attempting to isolate the effect of surgical correction for mild coronal curves, one must do this with respect to age-appropriate sagittal alignment.
In the context of age-appropriate sagittal alignment mentioned above, the results of this study were surprising and provide insight into this specific population that can aid in clinical decision making. The entire cohort presented with worse than expected baseline HRQoL metrics given the deformity was in the coronal plane and not the sagittal plane given we know that sagittal malalignment tends to be the primary diver of HRQoL [9,14-18]. The baseline mean ODI was 38.7 with a low PCS of 34.8 for the entire cohort and even worse for the Mild Scoli cohort with 44.3 and 31.0, respectively. Given that these patients had sagittal alignment that was within what would be predicted based on their age category [21], one might expect that their baseline pain and disability would be lower than that of ASD patients with sagittal malalignment. It is worth mentioning that these patients have worse baseline HRQoL than some of the major chronic disease states in the United States (US). A study by Bess et al. [44] compared HRQoL of patients with ASD to US population norms and other chronic diseases. The authors found that the norm-based PCS value for the ASD population between ages 55–64 years was 38.7 and the US population norm was 47.4, both are better than the current study population with mild scoliosis. In addition, the mean PCS for the US population were the following for various chronic diseases: back pain 45.7, depression 45.4, diabetes 41.1, cancer 40.9, heart disease 38.9, and the lowest being lung disease at 38.3 [44]. Our current population of patients with mild scoliosis has a much lower mean PCS of 31.0 than all of those in comparison.
With regard to the radiographic correction in the present study, there was a significant reduction in the maximum coronal curve at 2 years postoperatively but not the C7 plumb line. The lack of significant change in the C7 plumb line is likely a result of the baseline offsets being relatively small (mean, 2.5 cm) with a high variation (SD, 2.1 cm). And thus, this was the same for the 2-year postoperative value resulting in a failure to reach statistical significance despite the mean reduction being 3 cm. There was a significant amount coronal deformity correction (mean decrease of 23.6° overall and only 8.8º in the Mild Scoli group) as the sagittal spinopelvic parameters remained the same at 2 years postoperative. Moreover, the mean 2-year PT and SVA even increased a small amount, yet was not statistically different. However, the Mild Scoli patients had a significantly higher mean leg pain and ODI scores as well as worse PCS mean scores than the Scoli patients. This is likely the reason for the surgical indication in these patients. This is in contrast to the study by Daubs et al. [25] that investigated preoperative coronal imbalance and HRQoL. The authors demonstrated that correction of the coronal curve alone was not a factor for predicting improved functional outcomes and that sagittal malalignment was the strongest predictor. That population did have sagittal malalignment in addition to the coronal curves and was likely the driver of the improved outcomes. In the present study, we identified patients with only a coronal deformity that were within their age-appropriate sagittal alignment thresholds. The HRQoL improvement is also likely related to some patients receiving a direct decompression along with the deformity correction. This study has identified a small subset of ASD patients that have significant improvement in HRQoL with coronal correction and stabilization alone, even for mild scoliosis.
Given that historically coronal deformity correction has not shown as large of an improvement in HRQoL compared with sagittal deformity correction, the results of the present study were encouraging in that there was such a large improvement. There have been a number of studies looking at HRQoL improvement following surgical correction of ASD including MCID. Prior studies show that within a large cohort of ASD patients, the MCID improvements are ODI 49%, PCS 45%, SRS activity 63%, SRS pain 64%, SRS Appearance 74%, and SRS mental 43% [5]. Another study focusing on back and leg pain showed 2-year MCID rates of back and leg pain were 71% and 46%, respectively and for SCB they were 62% and 39%, respectively [6]. The mild scoliosis cohort had higher rates for all of those except SRS appearance and SRS mental scores, however they did have a significant improvement in mean SRS appearance. It was unexpected to have such high rates of MCID and SCB, however having lower SRS appearance and mental MCID rates and having the Mild Scoli group not meeting statistically significant improvement in SRS mental and MCS may be explained by their baseline status. The Mild Scoli cohort had small curves and had relatively higher MCS and SRS mental values. It is likely that the small curve did not play a role in their mental status and their poor HRQoL was more driven by pain and disability.
And lastly, the complication rate for the current study is higher compared with the means presented in the literature for ASD despite correcting smaller curves and having few 3-column osteotomies than the Scoli group. The rates reported in the literature from a large systematic review found that the mean overall complication rate was 55% with a major complication rate of 18.5% [45]. The present study found a higher overall complication rate of 64.3% and a higher major complication rate of 28.6%. This could be explained by the fact that no matter the extent of surgical invasiveness, ASD comes with certain inherent and unavoidable risks. Surgically manipulating the spinal column remains technically challenging. Even though these were only coronal curves being corrected with few large 3-column osteotomies, the mean posterior levels fused was still high at 10.9 and 62.3% had at least one osteotomy with a mean EBL of 1.3 liters. These surgeries may not be as invasive as correcting large combined sagittal and coronal deformities, but they are still large surgeries that carry a high rate of complications. Despite this, the overall cohort and the Mild Scoli cohort had large improvements in HRQoL as mentioned above. The inherent risk in these technically demanding surgeries should not be a barrier to surgery but rather a discussion point between surgeon and patients as to the best surgical plan for their goals of care.
The study strengths include the large multicenter design and a large number of ASD patients with age-appropriate sagittal alignment, 151 total. The multicenter design from 13 high-volume ASD centers across the US allows for better generalizability of the results. In addition, a strength of the present study is the complete 2-year follow-up of the patients. However, there are limitations to this study, one of which includes the retrospective design which may have introduced selection or information biases. Additionally, the definition of mild scoliosis was defined as 10°–30°. This definition is arbitrary however there is no standard definition of “mild” and this was decided upon discussion with multiple fellowship trained ASD surgeons. The pediatric literature has also discussed “mild” scoliosis with varying ranges that include less than 20°–30° [30-33]. The definition of “mild scoliosis” may differ in the adult population and vary across different populations of ASD patients. Despite the arbitrary definition of mild scoliosis, this study provides a starting point for addressing this particular deformity population and provided important data for preoperative planning/discussions with patients.
CONCLUSION
There exists a small population of ASD patients with coronal malalignment and age-appropriate sagittal spinopelvic parameters. They present with high baseline pain and disability, including patients with mild scoliosis of 10°–30° curves. The patients with mild curves have worse leg pain, ODI and PCS scores and likely the driver behind surgery. These patients benefit from surgical correction, decompression and stabilization at 2 years postoperative both radiographically and with significantly improved HRQoL and reduced disability. Of the mild scoliosis patients, 74% of them met MCID for SRS pain and back pain NRS despite having a high complication rate of 64.3%. This is the first study of its kind investigating the outcomes of this particular ASD population and provide the basis for future studies as well as important results for discussions between surgeons and patients to better inform decision making for preoperative planning.
Notes
Conflict of Interest
The authors have nothing to disclose.
Funding/Support
This study received no specific grant from any funding agency in the public, commercial, or not-for-profit sectors.
Author Contribution
Conceptualization: JKS; Data curation: JKS; Formal analysis: JKS; Methodology: JKS; Writing - original draft: JKS; Writing - review & editing: JKS, JSS, PGP, HJK, SB, DCB, EOK, VL, MG, CPA.