The Physiological Occlusion of the Central Canal May Be a Prerequisite for Syringomyelia Formation
Article information

Abstract
Objective
Syringomyelia is a common central nervous system disease characterized by the dilation of the central canal (CC). Regarding the pathogenesis of syringomyelia, cerebrospinal fluid (CSF) circulation obstruction in the subarachnoid space (SAS) of the spinal cord has been widely accepted. However, clinical and animal studies on obstructing the CSF in SAS failed to form syringomyelia, challenging the theory of SAS obstruction. The precise pathogenesis remains unknown.
Methods
We utilized an extradural compression rat model to investigate the pathogenesis underlying syringomyelia. Magnetic resonance imaging enabled detection of syringomyelia formation. To assess CSF flow within the SAS, Evans blue was infused into the cisterna magna. Histological analysis allowed morphological examination of the CC. Furthermore, CSF flow through the CC was traced using Ovalbumin Alexa-Flour 647 conjugate (OAF-647). Scanning electron microscopy (SEM) enabled visualization of ependymal cilia.
Results
The findings showed that the dura mater below the compression segment exhibited lighter coloration relative to the region above the compression, indicative of partial obstruction within the SAS. However, the degree of SAS occlusion did not significantly differ between syringomyelia (SM-Y group) and those without (SM-N group). Intriguingly, hematoxylin and eosin staining and CSF tracing revealed occlusion of the CC accompanied by reduced CSF flow in the SM-Y group compared to SM-N and control groups. SEM images uncovered impairment of ependymal cilia inside the syringomyelia.
Conclusion
CC occlusion may represent a physiological prerequisite for syringomyelia formation, while SAS obstruction serves to initiate disease onset. The impairment of ependymal cilia appears to facilitate progression of syringomyelia.
INTRODUCTION
Characterized by central canal (CC) dilation, syringomyelia forms fluid-filled cavities in the spinal cord, causing dissociative sensory loss, atrophy, and deformities [1-3]. Although the pathogenesis of syringomyelia is still unclear, the restriction of cerebrospinal fluid (CSF) flow in the subarachnoid space (SAS) is hypothesized as a primary factor [4]. However, clinical cases like spinal tumors/stenosis with SAS obstruction often lack syringomyelia [5-7]. Moreover, Berliner et al. [8] failed to induce syringomyelia in rats by suturing the spinal dura to restrict SAS CSF flow. These findings suggest SAS obstruction alone may not underlie syringomyelia pathogenesis.
The CC is a longitudinal tubular structure extending from the fourth ventricle to the conus medullaris, forming the filum terminale [9,10]. Kaolin-induced spinal cord injury elicits syringomyelia accompanied by CC occlusion, suggesting CC patency may contribute to pathogenesis [11,12]. Ependymal cilia lining the CC regulate CSF circulation; their loss causes CSF turbulence and CC expansion [13-15]. Therefore, we investigated the underlying mechanism of syringomyelia by an extradural compression-induced syringomyelia rat model [16]. We found CC occlusion may be a physiological prerequisite for syringomyelia formation in addition to SAS obstruction. Moreover, declining ependymal cilia may promote syringomyelia progression. In summary, our findings indicate CC occlusion, SAS obstruction, and ependymal cilia dysfunction synergistically contribute to a multifactorial pathogenesis of syringomyelia.
MATERIALS AND METHODS
1. Animals and Grouping
Female Sprague-Dawley rats aged 7 weeks and weighing 180–220 g were utilized for this study (Beijing Vital River Laboratory Animal Technology, Beijing, China) with approval from the Animal Ethics Committee of the Animal Experiment Center of Xuanwu Hospital, in accordance with China Animal Management Regulations. A total of 70 rats were utilized in this study, with 54 rats undergoing epidural compression and 16 rats undergoing sham operation. At 28 days postoperation (POD), magnetic resonance imaging (MRI) scans were performed. Of the 16 sham-operated rats and 24 of the 54 epidurally compressed rats, no syringomyelia was exhibited, while syringomyelia was exhibited in 30 of the 54 epidurally compressed rats. Rats were selected based on syringomyelia presence on MRI and divided into 3 groups: (1) control group (n= 16) undergoing sham operation; (2) SM-Y group (n= 21) exhibiting syringomyelia on MRI at 28 POD; and (3) SM-N group (n= 21) with extradural compression but no syringomyelia on MRI at 28 POD. All rats were sacrificed on the day of MRI testing (Fig. 1). Notably, syringomyelia in the SM-Y group (21 of 21) were consistently localized to adjacent segments (T10–12) rostral to the compression (T13). The number of rats per experiment was shown in Table 1.
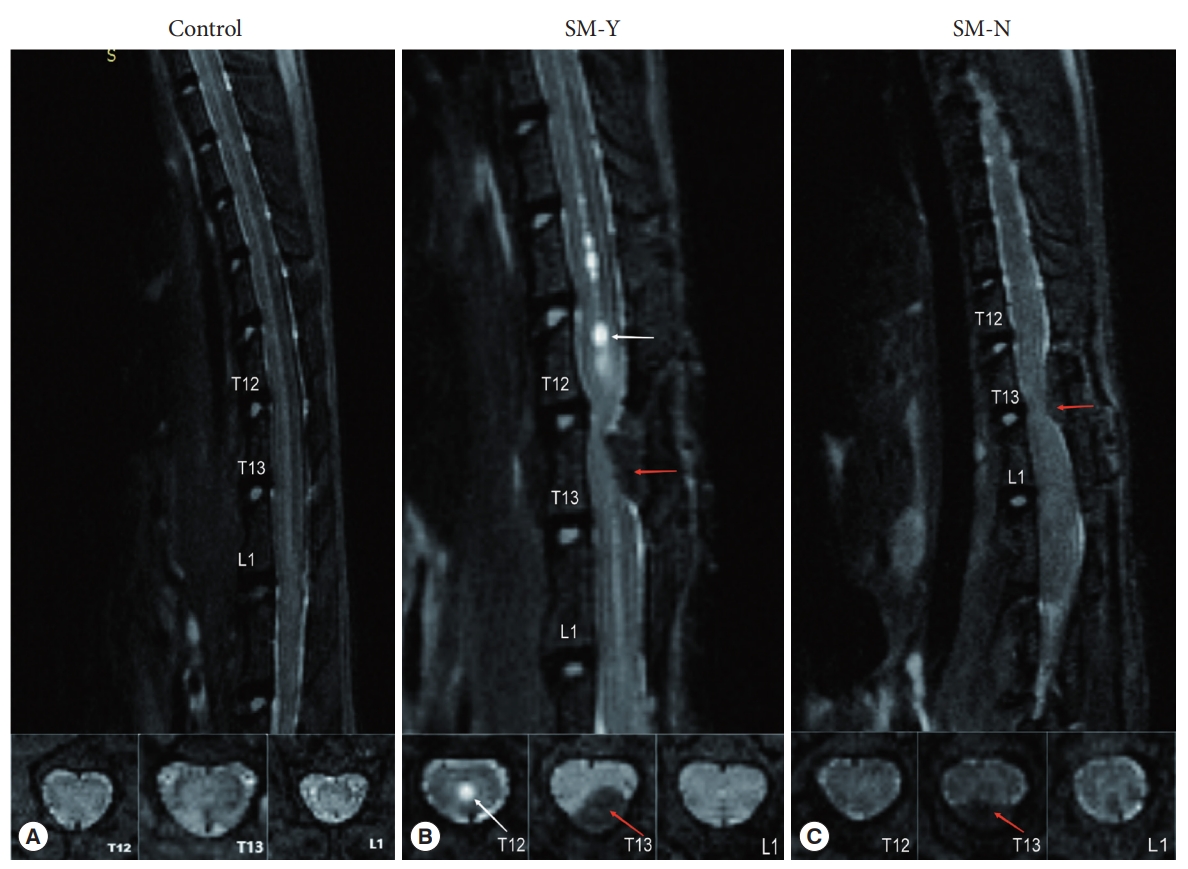
Magnetic resonance imaging of rats in the median sagittal and axial planes at T12, T13, and L1. (A) Control group. (B) Beaded-like syringomyelia (white arrow) at T11–12 defining the SM-Y group. (C) No syringomyelia formation in the SM-N group. Red arrow indicates cotton strip compression site. SM-Y, rats exhibited syringomyelia following extradural compression; SM-N, rats did not develop syringomyelia despite the compression.

The number of rats per experiment
2. Surgical Procedures
The surgical protocol has been described previously [16]. In brief, general anesthesia was induced with 2% enflurane, 70% nitrous oxide, and 30% oxygen. Rats were positioned prone on a thermostatic operating table with limb fixation. Body temperature was maintained at 36°C while monitoring heart and respiratory rates. A 3-cm midline skin incision was made over the T12–13 spinous processes. Using an operating microscope, the paraspinal muscles and T12–13 intervertebral space were carefully dissected to expose the epidural space and ligamentum flavum. The ligamentum flavum was then incised with microscissors. A hand-twisted cotton strip was inserted caudally beneath the T13 lamina into the epidural space. After irrigation with saline, the musculature and skin were sutured closed. For sham operations, the ligamentum flavum was incised without cotton insertion. Topical penicillin was applied post-operatively to prevent infection.
3. In Vivo MRI
Detailed procedures have been described in our previous study [16]. A 7.0 Tesla MRI scanner (PharmaScan 7T, Bruker Corp., Karlsruhe, Germany) equipped with 400 mT/m gradients was utilized at the Animal Imaging Experimental Center, Capital Medical University. Rats were positioned prone on the scanner bed with trunk restraints. Anesthesia was induced with 4% isoflurane in oxygen and maintained with 2% isoflurane via a rat mask during scanning. Following rapid whole-body localization scans in 3 planes, fat-suppressed rapid acquisition with relaxation enhancement sequences acquired T2-weighted sagittal and axial images centered on the surgical site. A 89-mm rat volume coil enabled radiofrequency transmission and signal detection. The imaging parameters for sagittal acquisition were time of repetition/time of echo (TR/TE)= 3,000/33 msec, matrix size = 256 × 256, field of view (FOV) = 60 × 40 mm2, slice thickness= 600 m with no gap, number of slices= 10, number of excitation (NEX)= 8, and resolution= 0.147× 0.147× 1 mm3. The imaging parameters for axial acquisition were TR/TE = 4,500/33 msec, matrix size= 256× 256, FOV= 60× 40 mm2, slice thickness=1 mm with no gap, the number of slices=30, NEX=8, and resolution= 0.147 × 0.147 × 1 mm3. Image data were processed using RadiAnt DICOM Viewer software (ver. 4.6.9, Medixant, Poznan, Poland).
4. CSF Tracer in the SAS
To visualize CSF flow within the SAS, 2.5% Evans blue (EB) was infused into the cisterna magna as a CSF tracer via a cannula. The cannula implantation followed as a published procedure [17]. Briefly, following general anesthesia and prone positioning, a small longitudinal incision was made over the occipital and cervical bones. Tissues and muscles were dissected to expose the atlanto-occipital fascia. A 34G needle punctured the membrane, through which a 4-cm long 0.28-mm internal diameter polyethylene-10 cannula filled with saline was inserted to a depth of 250–300 μm. Laminectomies were then performed at T10 and L2 to expose the transparent dura mater. Using a syringe pump (R462, RWD Life Science Co., Shenzhen, China), 150 μL of 2.5% EB was continuously infused through the cannula over 30 minutes. The puncture site and cannula were sealed with superglue to prevent CSF or EB leakage.
An operating microscope coupled to a real-time camera (Daofeng Corp., Beijing, China) and image processing software (SEYE, ver. 1.6.0.11) recorded the entire experimental procedure. Still images of the T10 and L2 dura mater were captured 30 minutes after initiating EB infusion. Dura mater grayscale values (range: 0= black to 255= white) at T10 and L2 were quantified using ImageJ (ver. 1.8.0.112, National Institute Health, Bethesda, MD, USA). To assess potential SAS obstruction, L2 grayscale values in SM-Y and SM-N groups were compared to control values, under the premise of comparable T10 grayscale across groups. The difference (D-value) between T10 and L2 grayscale values in SM-Y and SM-N groups was calculated to determine the degree of SAS occlusion (D-value = grayscale value of L2 - grascale value of T10).
5. CSF Tracer in the CC
To visualize CSF flow within the CC, ovalbumin conjugated to Alexa Fluor 647 (OAF-647, 45 kDa; Thermo Fisher Scientific Inc., Waltham, MA, USA) was injected into the cisterna magna as a CSF tracer using a micromanipulator-guided microsyringe. Briefly, the atlanto-occipital fascia was exposed as described for cannula implantation. A 10-μL microsyringe with a 30G beveled needle mounted on a stereotactic micromanipulator was inserted through the fascia. Five microliter of 25-μg/μL OAF-647 was gently administered over 1 minute, after which the needle was left in place to prevent leakage. At 10 or 20 minutes postinjection, animals were perfused and fixed in the supine position. Spinal cords were fixed in 4% paraformaldehyde for 24 hours and cryoprotected in 30% sucrose overnight at 4°C before embedding in optimal cutting temperature compound. 20- μm cryosections were collected, washed in phosphate-buffered saline (PBS), and coverslipped with DAPI (4’,6-diamidino-2-phenylindole). Images were acquired on a Zeiss Axio Imager Z2 confocal microscope (Carl Zeiss Microimaging, München, Germany).
6. Hematoxylin and Eosin Staining
For animal perfusion and fixation, 2,000-IU heparin in 500-mL phosphate-buffered saline was administered via intracardiac injection, followed by 500 mL 4% paraformaldehyde in 0.1M PBS at a flow rate of 40 mL/min. Successful perfusion was indicated by liver blanching. Spinal cords were carefully dissected and postfixed in 4% paraformaldehyde in 0.1M PBS overnight at 4°C. Fixed spinal cords were then dehydrated, embedded in paraffin, and sectioned at 4 μm collecting one section per 40-μm interval. Hematoxylin and eosin (HE) staining was performed, and all stained sections were digitally scanned using a high-resolution whole slide scanner (Panoramic MIDI, 3DHISTECH, Budapest, Hungary).
7. Scanning Electron Microscope
Following general intracardiac perfusion, spinal cords were dissected and stored at 4°C in a fixative containing 4% paraformaldehyde and 2.5% glutaraldehyde for 24 hours. Samples were longitudinally sectioned to expose the CC surface, washed in PBS, and postfixed in 1% OsO4 solution for 2 hours. Tissues underwent sequential dehydration in graded ethanol (50%, 70%, 80%, 90%, 100% x3) for 15 minutes per step before critical point drying. Dried samples were examined under an environmental scanning electron microscope Quanta 200 (FEI, Hillsboro, OR, USA) to visualize tissue ultrastructure and acquire images.
8. Statistical Analysis
Quantitative data including EB grayscale values and cilia counts were analyzed using Student t-test, 1-way analysis of variance (ANOVA), and 2-way ANOVA, as appropriate. A p-value ≤ 0.05 was considered statistically significant (ns p > 0.05, *p ≤ 0.05, **p ≤ 0.005, ***p ≤ 0.0005, ****p ≤ 0.00005 in Figs. 2–4). Results are expressed as mean ± standard deviation. All statistical analyses were performed using GraphPad Prism software (v7.02, GraphPad Software Inc., La Jolla, CA, USA).

The epidural infusion of Evans blue (EB) dye and grayscale analysis of the thoracic and lumbar spinal cord. (A, B) Representative images of the dura mater at the T10 and L2 spinal levels prior to EB infusion. (C-H) Representative images at 30 minutes after infusion of 2.5% EB solution at 5 μL/min into the cisterna magna. Control group (C, D), SM-Y group (E, F), and SM-N group (G, H, I). Cannula implantation in the cisterna magna sealed with superglue to prevent cerebrospinal fluid leakage (red rectangle: cisterna magna; yellow line: occipital margin). (J–L) Quantitative analysis of grayscale values (0 = black, 255 = white, lower grayscale values indicate darker coloration) among the 3 groups. (J) No significant differences in grayscale values at the T10 spinal level between groups. (K) Significant differences in grayscale values between T10 and T12 in the SM-Y and SM-N groups but not in controls. (L) No significant differences in the T10 to T12 grayscale value changes (D-values) between the SM-Y and SM-N groups (ns p > 0.05, *p ≤ 0.05, **p ≤ 0.005, yellow dashed line: laminectomy site and dura mater). SM-Y, rats exhibited syringomyelia following extradural compression; SM-N, rats did not develop syringomyelia despite the compression; ns, not significant.
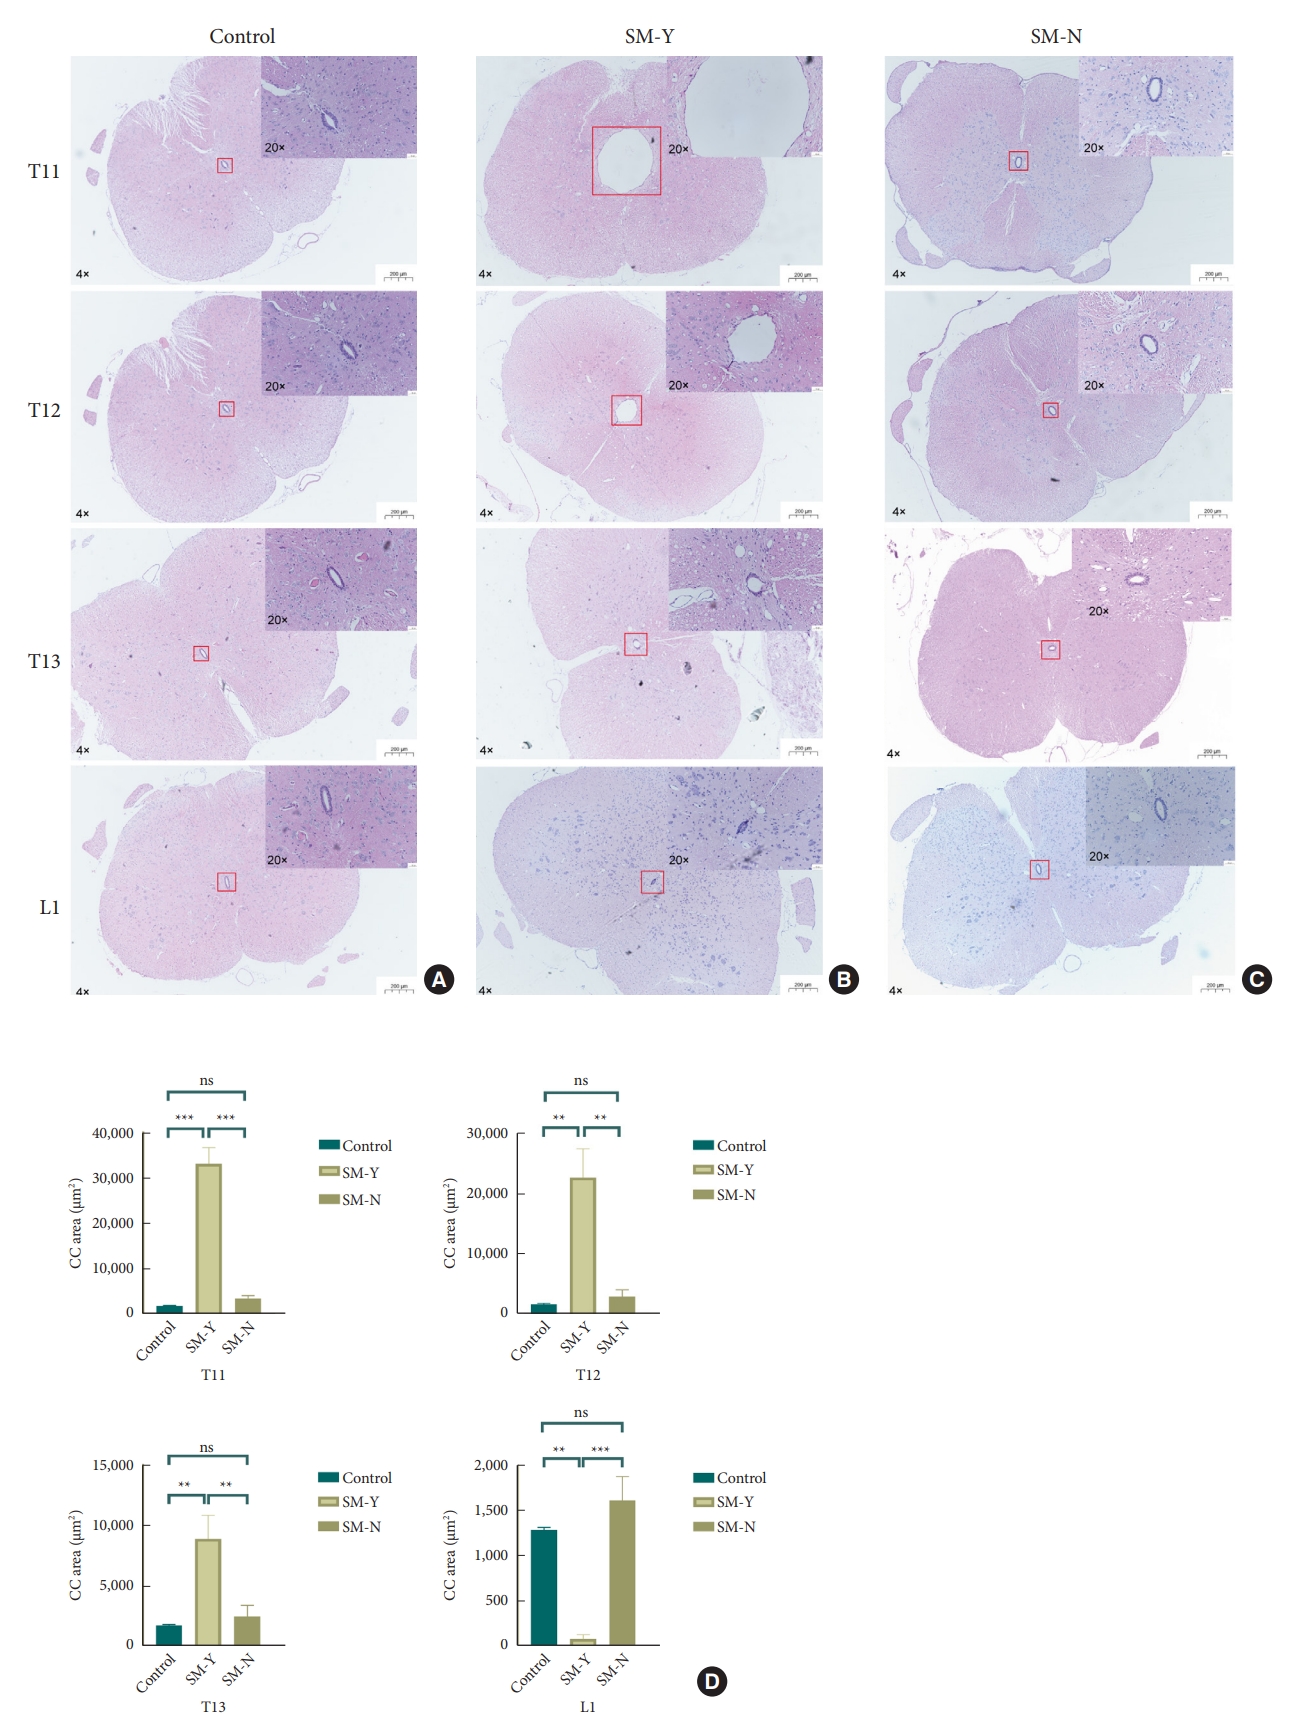
Histological analysis of central canal (CC) morphology from T11 to L1 spinal levels (hematoxylin and eosin stain). (A) Normal CC morphology in the control group. (B) Syringomyelia formation rostral to the compression site in the SM-Y group, with CC occlusion at L1. (C) No syringomyelia formation or CC occlusion in the SM-N group. (D) Quantitative comparison of CC cross-sectional area from T11 to L1 among the control, SM-Y, and SM-N groups. Overall views were imaged at 4 × magnification while insets were at 20 × (ns p > 0.05, *p ≤ 0.05, **p ≤ 0.005). SM-Y, rats exhibited syringomyelia following extradural compression; SM-N, rats did not develop syringomyelia despite the compression; ns, not significant.
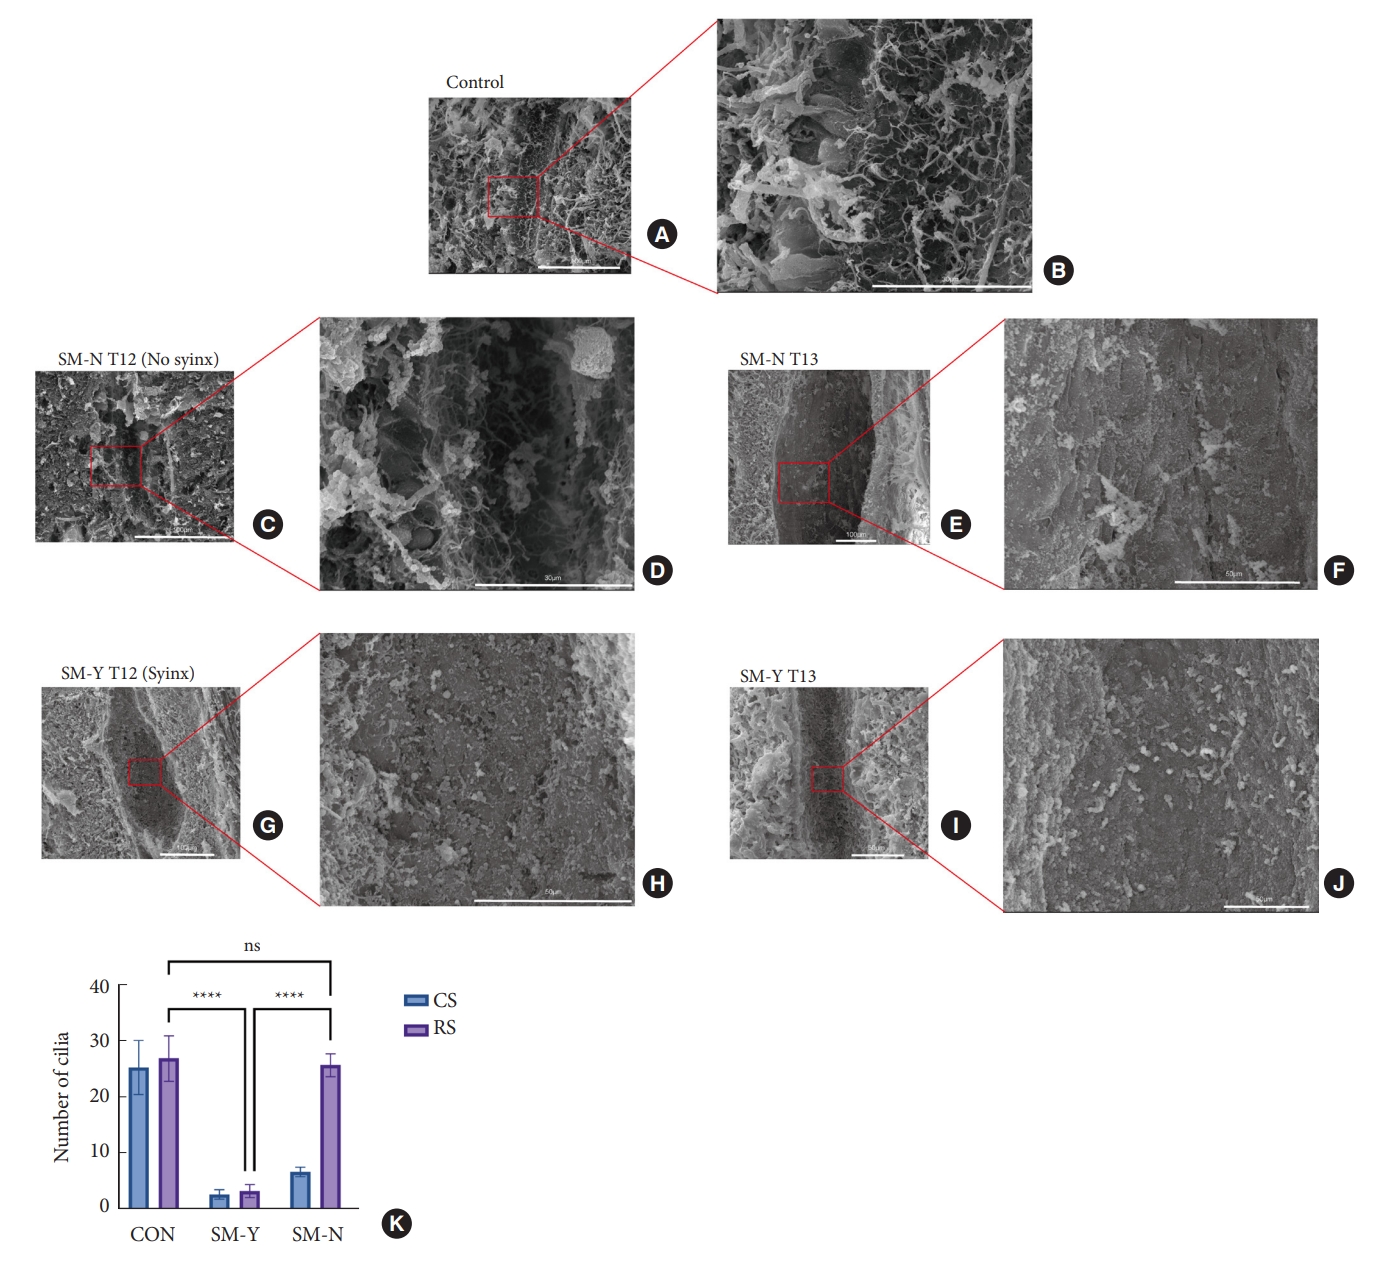
Scanning electron microscopy analysis of ependymal cilia morphology. (A, B) Normal cilia appearance in the central canal of control rats. (C, D) Intact ependymal cilia observed at the T12 region in the SM-N group. (E, F) Reduced cilia density at T13 in the SM-N group. (G, H) Severe cilia loss within syringomyelia at T12 of the SM-Y group. (I, J) Similarly reduced cilia density at T13 in the SM-Y group. (K) Quantitative comparison of cilia number at the compression segment (CS) and rostral adjacent segments (RS) among groups (ns p > 0.05, ****p ≤ 0.0005). SM-Y, rats exhibited syringomyelia following extradural compression; SM-N, rats did not develop syringomyelia despite the compression; ns, not significant.
9. Ethics Approval and Consent to Participate
All applicable international, national, and/or institutional guidelines for the care and use of animals were followed. All procedures performed in studies involving animals were in accordance with the ethical standards of the institution or practice at which the studies were conducted. (Experimental Animal Welfare Ethics Committee, Xuanwu Hospital, Capital Medical University, no. XWH2019002).
RESULTS
1. Degree of SAS Obstruction Showed No Difference Between SM-Y and SM-N Groups
We first examined the relationship between syringomyelia occurrence and SAS obstruction. Representative images show exposed dura mater before and after EB injection across groups (Fig. 2A–H). Cannula implantation in the cisterna magna is depicted (Fig. 2I). No significant difference in T10 grayscale values (0= black, 255= white, lower grayscale values indicate darker coloration) was found among groups (Fig. 2J). Compared to T10 values and controls, L2 grayscale values were significantly increased in both SM-Y and SM-N groups (Fig. 2K), indicating SAS obstruction due to extradural compression. However, no significant difference in T10–L2 grayscale value differences (D-values) existed between SM-Y and SM-N (Fig. 2L), suggesting the degree of SAS obstruction did not correlate with syringomyelia occurrence. In summary, while extradural compression caused SAS obstruction that may contribute to pathogenesis, the severity alone did not determine syringomyelia development.
2. SM-Y Group Showed an Occlusion of CC and the Slowest CSF Flow
To investigate the role of the CC in syringomyelia, we examined CC morphology and CSF flow. HE staining revealed CC occlusion with ependymal cell adhesion exclusively in the SM-Y group, while the CC remained patent at corresponding spinal levels in controls and the SM-N group. Quantitative evaluation demonstrated dramatically increased CC area at T11 and T12 in the SM-Y versus control and SM-N groups, indicative of syringomyelia formation. However, the CC area sharply decreased at L1 in SM-Y compared to controls and SM-N. Notably, occlusion occurred not centrally at the compression but rather at the caudal CC between T13 and L1. Without occlusion, the SM-N group exhibited a slight but insignificant expansion trend at T11-T13 (Fig. 3).
Furthermore, we examined how extradural compression impacts CSF flow within the CC. The T13 segment, located above the occlusion at the caudal end of the syringomyelia, was selected for analysis to best reflect overall CSF dynamics through the intact CC. Observation of CSF tracer distribution at this site allowed assessment of flow changes affecting the entire CC. At 10 minutes postinjection of the OAF-647 tracer, fluorescence signal was detected only within the CC of controls (Fig. 5A). However, by 20 minutes postinjection, signal was observed in the CC of controls and the SM-N group (Fig. 5D, E) but remained absent in the SM-Y group (Fig. 5F). These findings indicate extradural compression slows CSF velocity within the CC regardless of syringomyelia presence, with greater impedance of flow in the SM-Y versus SM-N groups. CC occlusion may further retard CSF dynamics, representing a key physiological disturbance underlying abnormal CSF flow and syringomyelia pathogenesis.

Analysis of cerebrospinal fluid tracer Ovalbumin Alexa-Flour 647 conjugate (OAF-647) distribution in the central canal (CC). (A–C) At 10 minutes postinjection, no OAF-647 fluorescence signal was detected in the CC at T13 in the SM-Y and SM-N groups compared to controls. (D–F) At 20-minute postinjection, a faint OAF-647 signal was observed in the CC of the SM-N group compared to controls, while no signal was still detectable in the SM-Y group CC. Overall views were acquired at 4 × magnification, while insets were at 20 × . OAF-647 fluorescence is shown in green and DAPI (4´,6-diamidino-2-phenylindole) nuclear counterstain in blue. SM-Y, rats exhibited syringomyelia following extradural compression; SM-N, rats did not develop syringomyelia despite the compression.
3. The Decline of Cilia in Syringomyelia
Previous studies have demonstrated declining cilia within the CC in syringomyelia animal models and human autopsies [18,19]. We thus examined CC cilia status via scanning electron microscopy. In controls, abundant cilia lined the CC lumen (Fig. 4A, B). However, at the compression segment, cilia were markedly reduced in both SM-Y and SM-N groups compared to controls, without significant difference between SM-Y and SM-N. Notably, cilia loss extended to the inner wall of syringomyelia, while the intact cilia observed in corresponding regions in controls and SM-N (Fig. 4C–K). The extensive cilia decline accompanying CC occlusion in the SM-Y group may contribute to the greater impedance of CSF flow compared to the SM-N group. These results suggest dysfunctional cilia, both at the compression and adjacent rostral segments, may play a role in promoting the progression of syringomyelia.
DISCUSSION
1. The SAS Obstruction Is Not the Only Cause of Syringomyelia
Although the mechanism underlying syringomyelia remains controversial, SAS obstruction has been recognized as a key contributing factor [4,20]. The widely accepted hypothesis posits that SAS obstruction creates a fluid pressure gradient between the SAS and CC, increasing CSF influx into the “SAS-spinal parenchyma-CC” pathway via perivascular spaces, resulting in fluid accumulation and syringomyelia formation. Relevant molecular mechanisms have been discussed for decades [21-27]. Clinically, contrast-enhanced studies reveal increased CC signal in syringomyelia patients versus controls, suggesting excessive SAS CSF influx into the CC [28]. Additionally, surgical SAS decompression for obstruction (e.g., Chiari I malformation, arachnoiditis) often successfully resolves syringomyelia [29,30]. However, transverse SAS ligation failed to induce syringomyelia in rats. Furthermore, clinical SAS obstruction from spinal tumors or stenosis impedes CSF flow but does not always induce syringomyelia [5-8]. In this study, instead of post-mortem fluorescence staining, we continuously pumped EB dye into the cisterna magna of living animals to observe color changes in the dura mater above and below the compression site, determining SAS obstruction. Although the compression did cause SAS obstruction both in SM-Y and SM-N group compared to control, the degree of SAS obstruction did not correlate with syringomyelia formation. Collectively, these findings challenge the notion that SAS obstruction alone underlies syringomyelia pathogenesis.
2. CC Occlusion Is Correlated With Syringomyelia Occurrence
Aside from the SAS, the CC represents another important CSF pathway. In contrast to occlusion in humans, studies demonstrate patency of the CC in rats, which functions as a channel for CSF outflow. In rats, the CC directly receives CSF from the fourth ventricle and excretes it into the blood via the terminal filament and cauda equina [30-32]. The CC’s role in syringomyelia remains hypothetical due to a lack of methods to selectively occlude the CC without spinal cord injury in animals. Here, we examined CC morphology and CSF flow. CC occlusion was observed at the T13–L1 junction exclusively in the SM-Y group, while the CC remained patent in SM-N. Moreover, CSF trace showed that the CSF flow velocity in the CC was significantly reduced in both SM-Y and SM-N compared to controls, with greater impedance and stasis in SM-Y. Notably, we did not use OAF-647 to evaluate CSF flow in the SAS because of the concerns over dural damage from tissue extraction. Compare to EB infusion in living animal, post-mortem staining risked generating ambiguous, misleading data of CSF flow in SAS. These findings suggest CC occlusion, potentially resulting from extradural compression, dramatically slows CSF flow through the CC. Along with SAS obstruction, CC occlusion may represent a necessary condition for syringomyelia formation by disrupting CSF dynamics.
3. The Decline of Ependymal Cilia in Syringomyelia
As mentioned, CSF flow was reduced in SM-N versus controls despite an open CC, suggesting additional factors contribute to flow impedance. Lining the ventricles and CC, multiciliated ependymal cells bear motile cilia that coordinate CSF movement [33]. Ependymal cilia dysfunction can lead to CC flow turbulence [15,34]. In kaolin-induced syringomyelia, cilia shedding and lodging in syringomyelia was observed [18]. Moreover, human autopsies revealed stretched, deciliated ependyma in syringomyelic cords [19]. Clinical and animal studies confirm ependymal cilia loss causes ventricular expansion and fluid accumulation [35,36]. Here, cilia decline was observed within syringomyelia in SM-Y, aligning with literature. However, intact cilia were noted at T10–12 in SM-N despite declines at the T13 compression. This suggests cilia dysfunction at the compression site may slow CSF flow in SM-N. Overall, concurrent with CC occlusion, extensive cilia impairment along the CC critically slowed flow and may promote CC dilation and syringomyelia development.
4. Clinical Relevance
Physiological differences between rats and humans likely underlie the distinct CC functions. In rats, the CC remains patent, comprising an integral pathway for CSF circulation from the ventricles through the cauda equina/conus into the bloodstream [32]. In contrast, little is known regarding normal human CC function. Numerous histological findings and morphometric analysis of human CC have been published in the past few decades. Cornil and Mosinger [37] found 71% CC occlusion from randomly selected sections of human spinal cord and suggested the occlusion was due to ependymal cells proliferation and gliovascular scarring, while Netsky [38] found that nearly 80% CC was occluded. In 1994, Milhorat et al. [39] described the first detailed histological study of human CC in 232 subject ranging in age from 6 weeks to 92 years. The stenosis process was mostly observed at T2–8 segment of spinal cord and involved higher grades of CC occlusion in elder subject. A histological review revealed that the lumen patency above and below syringomyelia may be an important factor in syringomyelia development, which was consistent with the result in present animal study. In 1995, Milhorat et al. [19] analysied the pathological basis of syringomyelia in 105 autospsy cases, which indicating a 70% CC and 30% eccentric syringomyelia. Thus, since most of the CC is occluded in human, alongside SAS obstruction (e.g., Chiari), syringomyelia may occur. In traumatic syringomyelia, external forces could directly damage ependymal cilia, hastening CC expansion. Though SAS decompression sometimes helps, variable outcomes suggest fixing bidirectional CSF flow between the CC and SAS, not just SAS obstruction, is key for resolution. Reconstructing CC patency may be required alongside SAS decompression to a better outcome.
In this study, CSF flow was only assessed at the T13 level to avoid confounds from syringomyelia size variations at more rostral levels. However, this raises questions regarding CSF dynamics within and above the syringomyelia. To address this, future studies could supplement cisterna magna injections with in situ CSF tracer administration directly into the syringomyelia and rostral CC. This combined approach may provide further insight into CSF flow changes underlying syringomyelia formation and enlargement. Due to the substantial biological differences exist between animal models and human patients, rather than fully replicating clinical scenarios, this model primarily provides insight into possible pathogenetic roles of CC patency and cilia integrity that are challenging to explore in humans.
Furthermore, whether ependymal cilia dysfunction actively promotes syringomyelia development or represents a secondary pathological change in syringomyelia remains unclear. Idiopathic syringomyelia cases lacking SAS obstruction [40,41]. may arise from congenital cilia deficits and CC occlusion. Thus, methods to repair damaged cilia may slow progression and facilitate syringomyelia recovery.
5. Limitations
This study has some limitations to address going forward. First, patients typically develop syringomyelia distal to the compression level, unlike the present model. The mechanisms underlying this discrepancy require further investigation. Second, this model focus on CC rather than eccentric syringomyelia, which have certain limitations to mimic all situations in clinical settings. The pathogenetic mechanisms warrant investigation with more accurate methods and larger sample sizes to quantify CSF dynamics within the CC and SAS. Third, direct visualization of ciliary beating was not feasible in the narrow CC, contrasting brain ventricles. Improved techniques to assess CC cilia motility warrant development.
CONCLUSION
By examining CSF dynamics within the CC and SAS alongside ependymal cilia integrity in an extradural compression-induced syringomyelia rat model, we gained novel insight into syringomyelia pathogenesis. Our findings suggest CC occlusion may be a physiological prerequisite for syringomyelia formation that, in conjunction with SAS obstruction, leads to CSF flow disturbances underlying syringomyelia development. Moreover, declining ependymal cilia appear to facilitate syringomyelia progression. This work highlights the need to look beyond SAS CSF flow and consider the multifaceted roles of CC morphology and ciliary function. Future studies should focus not only on SAS dynamics but also CC patency and ependymal integrity to better elucidate this complex disorder.
Notes
Conflict of Interest
The authors have nothing to disclose.
Funding/Support
This research was supported by grants from the Beijing Municipal Natural Science Foundation (No. 583003) funded by Beijing Municipal Science & Technology Commission (Grant number: Z191199996619048 and L212007).
Author Contribution
Conceptualization: CJ, XW, FJ, CL, LM; Data curation: CJ, XW, KL, WL, SC, XW; Formal Analysis: CJ, YF; Funding acquisition: FJ; Investigation: KL, WL, SC, XW; Methodology: CJ, FJ, XW, KL, WL, SC; Project Administration: CJ, CL, QI, XW; Visualization: CJ, CL, QI, YF; Writing – Original Draft: CJ; Writing – Review & Editing: CJ, XW.
Acknowledgements
We would like to acknowledge our colleagues Lei Cheng, Chenghua Yuan and Penghao Liu from Xuanwu Hospital for advising the current subject. Thanks to other relevant researchers: Jianfeng Lei, Zhanjing Wang, and Wenqi Wu from Capital Medical University for technical support in MRI test; Zixin Zhu, Yufeng Wang and Wenrong Zheng from Animal research center of Xuanwu Hospital for helping in animal feeding and care; Jingjing Wang, Qian Li, Yan Yang and Chenguang Zhao from Tsinghua University for the technical support and guidance of scanning electron microscope.