Computer Vision in Osteoporotic Vertebral Fracture Risk Prediction: A Systematic Review
Article information

Abstract
Osteoporotic vertebral fractures (OVFs) are a significant health concern linked to increased morbidity, mortality, and diminished quality of life. Traditional OVF risk assessment tools like bone mineral density (BMD) only capture a fraction of the risk profile. Artificial intelligence, specifically computer vision, has revolutionized other fields of medicine through analysis of videos, histopathology slides and radiological scans. In this review, we provide an overview of computer vision algorithms and current computer vision models used in predicting OVF risk. We highlight the clinical applications, future directions and limitations of computer vision in OVF risk prediction.
INTRODUCTION
Osteoporosis is a pervasive condition marked by reduction in bone density and altered bone microarchitecture, rendering bones fragile and susceptible to fractures [1,2]. These “fragility fractures,” can arise from minor trauma or even under physiologic stress including actions as benign as sneezing. As individuals age, the probability of incurring these fractures rises, predominantly affecting the spine, hip, wrist, and humerus [3]. Osteoporotic vertebral fractures (OVFs) stand out as the most prevalent among these, with approximately 1.5 million cases reported annually in the United States with an estimated economic cost of 13.8 billion dollars [4,5]. OVFs carry significant morbidity as they are associated with both acute and chronic back pain, height loss, kyphosis, diminished quality of life, and increased mortality [6]. Even after controlling for comorbidities, patients with OVFs experience an overall mortality rate almost twice that of matched controls [7]. Furthermore, a history of spine fracture elevates the risk of another spine fracture by 5 times and doubles the risk of hip and other fractures [8-11]. Despite the clear health implications, osteoporosis screening is still significantly underutilized [12].
Dual energy x-ray absorptiometry (DXA) scans are widely recognized as the gold standard for assessing bone mineral density (BMD), serving as a crucial tool for determining an individual’s fracture risk [13]. The World Health Organization defines osteoporosis as a BMD that falls 2.5 standard deviations below the peak density observed in healthy young adults [14]. However, it has been shown that half of patients with fragility fractures do not have osteoporosis suggesting that BMD alone is insufficient [15-17]. As such, tools like the FRAX calculator have been introduced to provide a more comprehensive estimate of a person’s fracture risk by integrating BMD readings with a multitude of independent clinical risk factors [18]. These range from age, ethnicity, and body mass index (BMI) to elements such as history of prior fractures, glucocorticoid use, and presence of other conditions such as rheumatoid arthritis [18]. Though these methods are well-established and validated, their utilization is limited. In fact, fewer than 23% of individuals receive the recommended DXA scan, making it challenging to pinpoint those at high risk and initiate timely interventions [19-24]. Additionally, even among those who do undergo DXA scans, FRAX application is still sparse due to constraints such as limited time, physician awareness, and fragmented medical records [19,20,23].
In recent years, newer metrics of bone health and strength have emerged, including the trabecular bone score (TBS) and the bone strain index (BSI) [25-28]. While BMD provides a measure of bone strength, TBS offers insights into the bone’s microarchitectural quality [25,26,29,30]. A lower TBS suggests a deteriorated bone structure and can be used to independently predict fracture risk [26,29,30]. Combining TBS with BMD paints a more comprehensive picture of fracture risk, and recent innovations have augmented the predictive power of the FRAX score through TBS [26,29-31]. BSI is a relatively new metric that aims to predict femoral and spinal fracture risk independent of both BMD and TBS [27,28]. Through finite element analysis (FEA), BSI aims to quantify the strain that bones experience as different types of stress are induced, thereby shedding light on their robustness and susceptibility to fracture [27,28]. Nevertheless, both BSI and TBS, which are derived from DXA images, are underutilized for reasons as discussed above. Furthermore, the specialized tools required to compute these indices often prevent wider adoption across institutions.
Alternative methods for assessing bone health, such as quantitative computed tomography (QCT), high resolution peripheral QCT (HR-pQCT), micromagnetic resonance imaging, and quantitative ultrasound have been proposed [32]. However, the widespread adoption of these modalities has been impeded by concerns related to cost, radiation exposure, or ability to predict fracture risks. Given these challenges, there is a need for the development of more sophisticated and refined diagnostic approaches that can overcome these limitations.
Computer vision (CV), an offshoot of artificial intelligence, allows computers to interpret and make inferences from images and videos. More narrowly, a subset of CV known as radiomics is dedicated to the comprehensive, automated high-throughput extraction of quantitative medical image features. This extraction captures intricate disease characteristics, often elusive to the human eye, thereby enhancing diagnostic and predictive accuracy in clinical settings. Notably, CV and radiomics have made considerable inroads in other medical fields such as tumor segmentation, seizure analysis, and etc [33]. Therefore, in recent years, CV has been increasingly used to predict vertebral fracture risk within the context of osteoporosis.
This review synthesizes the existing literature, offering a comprehensive overview of CV techniques and current CV models employed in predicting osteoporotic vertebral compression fractures. Furthermore, it underscores their clinical applications, limitations, and potential future trajectories.
METHODS
PubMed, Embase, and Web of Science were used as the primary databases for electronic article searching. The National Library of Medicine’s PICO (patient/population/problem, intervention, comparison, and outcome) guideline was used to guide the literature search terms. The term “P (spine and compression fracture) I (predictive model)” was used, with “C” and “O” being omitted as to maximize the capture of relevant papers. The MeSH (medical subject heading) terms used in the search included: spine, vertebral, fracture, compression, predictive model, and prediction. The formal search consisted of the following structure: “(spine OR spinal cord OR vertebrae OR vertebral) AND (fracture OR compression fracture OR vertebral compression fracture OR VCF) AND (prediction model OR predictive model OR prediction).” This search yielded a total of 7,629 results which was then screened through an abstract review to yield a total of 37 papers which underwent a full-text review. The final papers were chosen based on the following inclusion criteria: (1) primary research studies that utilized CV for assessment of OVF risk and (2) studies written in English. Exclusion criteria included studies that utilized singular userconstructed metrics (i.e., BMD, TBS, BSI, FRAX, and etc.) to predict OVF risk without an accompanying CV model and (2) papers that employed a cross-sectional design in which OVFs were predicted using scans that contained the fractured vertebrae. There was a total of 6 papers that fit the inclusion and exclusion criteria present in our search. Due to the heterogeneity in imaging modalities and algorithms used across the studies, a meta-analysis was not conducted (Fig. 1).

PRISMA (preferred reporting items for systematic reviews and meta-analyses) methods outline.
UNDERSTANDING COMPUTER VISION
Before exploring the clinical applications of CV for the prediction of osteoporotic vertebral compression fractures, it is crucial to understand the methodologies and metrics underpinning these studies. We discuss the overall workflow of a CV model (Section 3.1), and the different machine learning (ML) algorithms used for classification (Section 3.2).
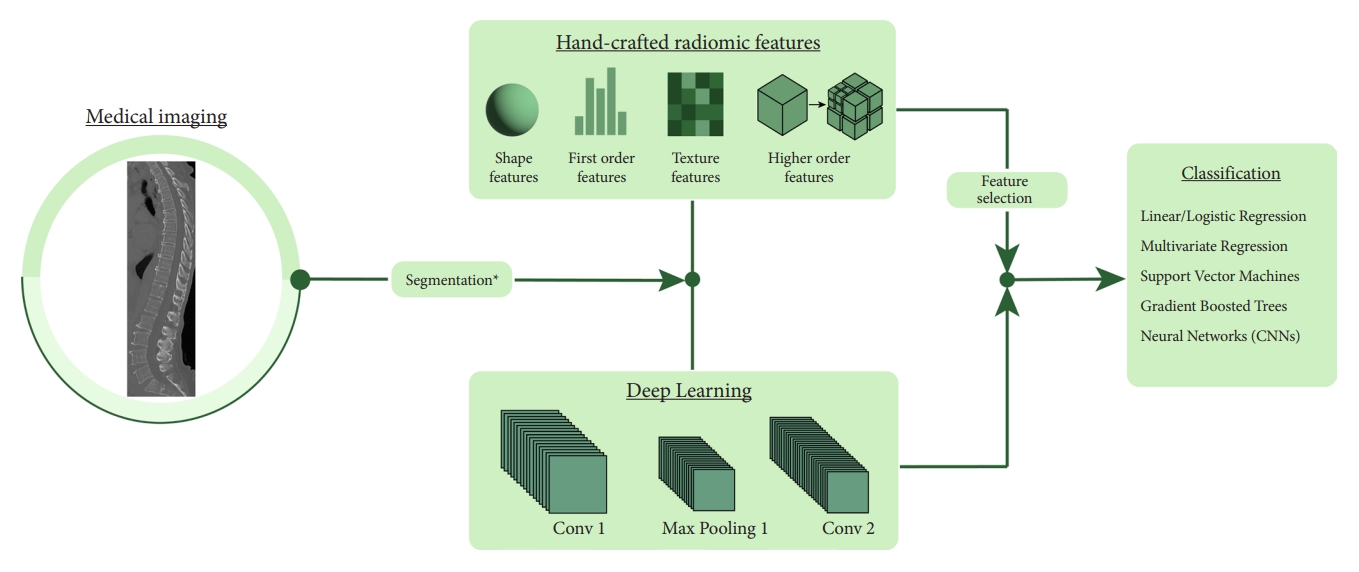
1. CV Workflow
A CV model begins with identifying a region of interest (ROI) within the larger image. This step can be done either manually or with the assistance of pretrained ML tools. This ROI is then used to extract a range of metrics that provide insights into its intrinsic qualities. Within the scope of radiomics, the metrics extracted can be broadly categorized into 4 main types:
Shape Features: These features convey information regarding the geometric shape and the size of the ROI without considering voxel intensity. Metrics include volume, surface area, and other shape-related descriptors.
First-Order Features: These features represent the distribution of individual voxel intensities without any emphasis on the relationship between the voxels. Examples include mean, standard deviation, entropy, and others.
Texture Features: These features focus on patterns and voxel relationships, offering insights into the heterogeneity of the ROI. Such features can uncover subtle differences in tissue characteristics and include metrics such as gray-level co-occurrence matrices, gray-level run matrices, among others.
Higher-Order Features: Finally, higher-order features are derived from transformed image spaces or by applying specific filters that can detect intricate patterns and relationships not readily observable in the primary image. Examples include wavelet transform and the Laplacian of Gaussian.
Extracting these features is one of the hallmarks of CV. In contrast to traditional methods that rely on a limited set of manually defined metrics, CV allows for the extraction of a wide array of features. This rich diversity in features allows for the detection of nuanced interrelationships that are critical for imaging tasks. In ML workflows involving CV, human intervention is still essential for selecting features considered most relevant. However, the scope of initial feature selection in these workflows is much broader compared to traditional methods. In contrast, deep learning represents a paradigm shift towards a fully data-driven methodology. It automatically computes its own features, which, although highly informative, are often complex and challenging for humans to interpret.
Once the features have been extracted from the data, they are then selected to make sure only the most informative ones are kept in the final model. Features that show significant variability across patients and samples are typically deemed unreliable. Metrics such as the intraclass correlation coefficient aid in filtering these out. Subsequently, techniques like least absolute shrinkage and selection operator (LASSO) and Boruta are employed to pinpoint the most predictive features for the target classification task. These curated features are then used in ML models to arrive at the final prediction.
2. Overview of Machine and Deep Learning Models
In the realm of machine/deep learning, models can be broadly categorized into parametric and nonparametric based on their underlying assumptions and approaches. Parametric models make strong assumptions about the underlying distribution of the data. Examples include linear and logistic regression. On the other hand, nonparametric models do not make strong statistical assumptions about the underlying distribution. Examples include support vector machines (SVMs), decision trees, and deep learning algorithms. Nonparametric models can be more flexible and accurate for complex data distributions, but they often require more data, can be slower, and may risk overfitting if not handled properly.
1) Linear and multivariate regression
Linear and multivariate regression serve as foundational parametric algorithms in the realm of ML. Linear regression predicts the value of a dependent variable from a single independent variable under the assumption of a direct linear relationship. Multivariate regression extends this idea by predicting a dependent variable based on multiple independent variables, allowing it to model scenarios where multiple factors interplay to influence an outcome. In our review, we observed that 2 studies employed variations of regression analysis in their methodologies. Dieckmeyer et al. [34] first utilized a deep learning algorithm to segment vertebral bodies, which were then analyzed with radiomics to extract features. These features were used as input variables in a logistic regression model for classification purposes. In a similar fashion, Wang et al. [35] utilized radiomics for feature extraction; however, their approach differed in that they used these features as predictors in a layered multivariate regression model.
2) Support vector machines
SVMs are a widely used nonparametric model in the realm of ML. They are especially known for their performance in classification tasks. At its core, an SVM works by finding a hyperplane that best divides a dataset into classes. This hyperplane is determined in a way that maximizes the margin between the nearest data points (or support vectors) of the 2 classes, ensuring optimal separation. In cases where data is not linearly separable, SVMs employ a technique called the kernel trick to transform the data into a higher-dimensional space which can be more easily separated. In our review, a study by Muehlematter et al. [36] utilized an SVM for classification. In their methodology, they first applied radiomics to extract features from CT scans. These extracted features were then used as input variables to the SVM.
3) Decision trees and gradient boosted models
Decision trees are the foundation of tree-based ML algorithms. They operate by partitioning data at every node using a specific feature criterion. As data navigates through the tree, subsequent nodes refine this partitioning based on different features until a classification is reached. One of the inherent limitations of tree models is their difficulty in representing inter-feature relationships. A gradient boosting model functions by sequentially building decision trees, where each subsequent tree aims to correct the errors of its predecessor. Our review included one paper that utilized a gradient boosted tree. Atkinson et al. employed radiomics for feature extraction, subsequently using these features in a gradient boosted tree to carry out classification [37]. Unlike some other models, gradient boosted trees have the dual capability of performing both feature selection and classification, setting them apart in their methodology.
4) Convolutional neural networks
Convolutional neural networks (CNNs) is one of the most popular deep learning algorithms used for image processing. CNNs employ convolutional layers, where small, learnable filters slide over input data, extracting localized features. As these layers deepen, the network discerns more intricate patterns, transitioning from simple edges to complex structures like shapes or objects. In our paper, we reviewed 3 studies that implemented 2-dimensional (2D)-CNNs in distinct ways within their framework. Dieckmeyer et al. [34] utilized a 2D-CNN to automatically segment vertebral bodies. Following this step, their approach diverged and instead utilized a combination of radiomics and a logistic regression to complete the analysis pipeline. In contrast, Kong et al. [38] expanded the role of the CNN beyond segmentation. In their study, the 2D-CNN was utilized not only for vertebral segmentation but also for the subsequent classification task. Finally, Nissinen et al. [39] adopted a methodology similar to that of Kong et al. [38], utilizing a 2D-CNN for both feature extraction and classification tasks in their analysis of DXA scans. This approach highlights a more extensive application of 2D-CNNs (Fig. 2).
CLINICAL APPLICATIONS IN OVF RISK PREDICTION
1. Computed Tomography
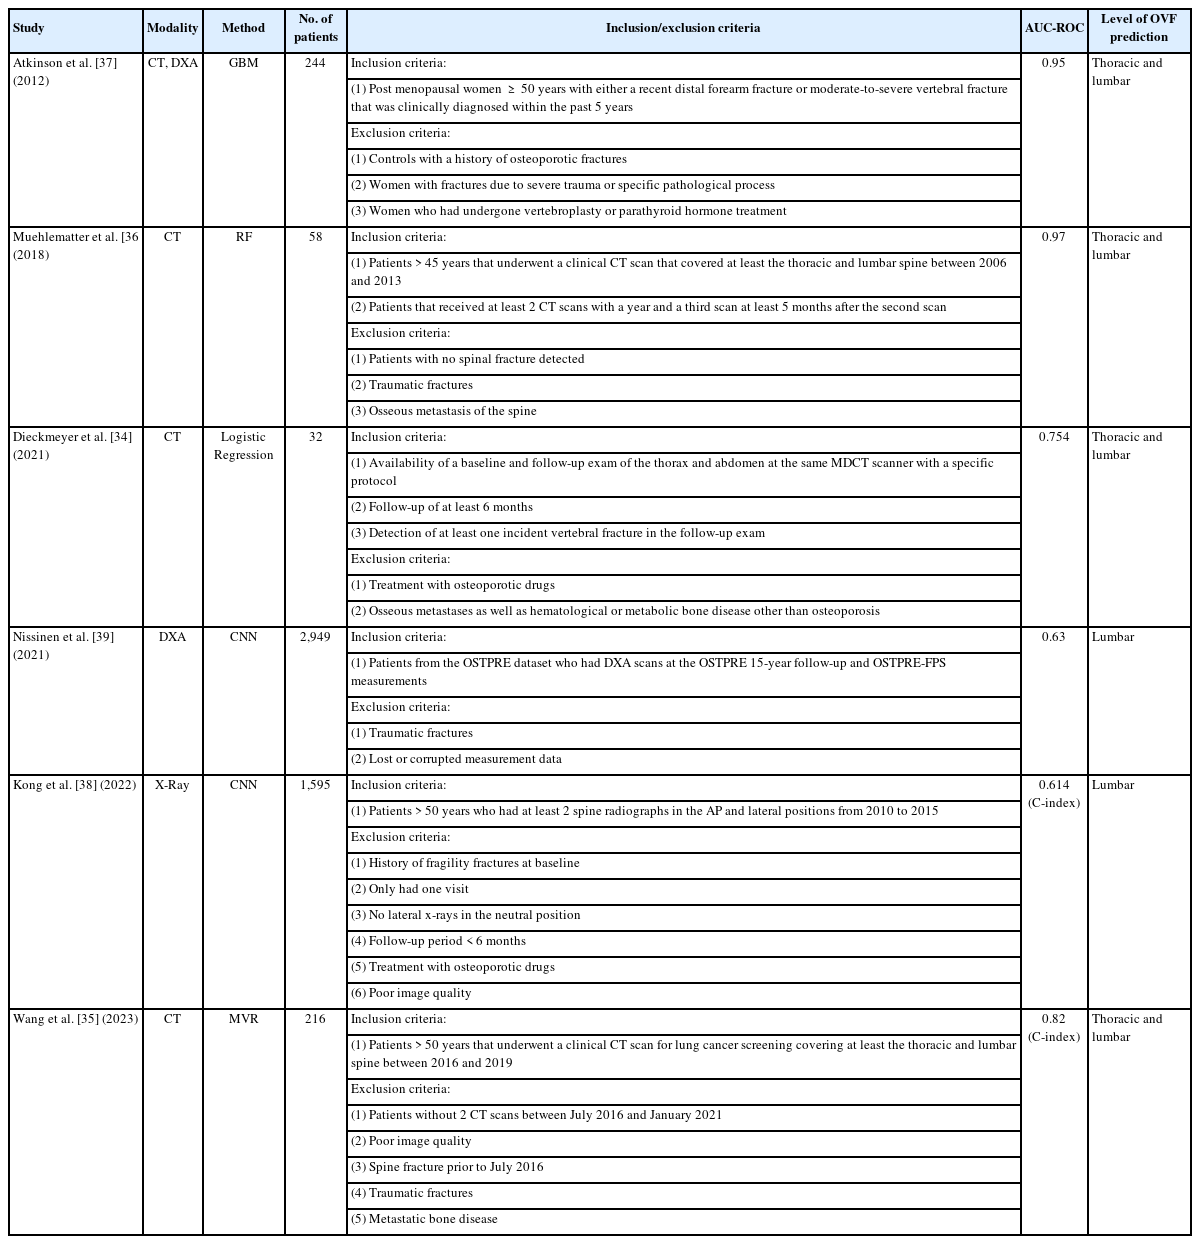
Atkinson et al. [37] was one of the first groups to utilize a CV-based approach to assess the risk of OVFs. The study included 2 distinct cohorts: those with distal forearm (DF) fractures which was comprised of 204 participants (99 cases and 105 controls) and those with vertebral fractures (VFs) which was comprised of 118 participants (40 cases and 78 controls). The researchers then extracted a myriad of radiomic features from various imaging modalities: 67 from HR-pQCT, 144 from Spiral QCT, and 62 from DXA, summing up to 267 variables. Additionally, height, weight, BMI, and femoral neck areal BMD (FN aBMD) were included as features in all models. Subsequently, these models were trained to predict fracture status (case vs. control) either using individual sets of variables from HR-pQCT, Spiral QCT, and DXA or a combination of all. For comparison, a simple regression model using only FN aBMD was established as a baseline. When a gradient boosted model was trained on the DF cohort and tested on the VF cohort, the area under the curvereceiver operating characteristic (AUC-ROC) values were 0.88, 0.82, 0.94, and 0.95 using DXA, HR-pQCT, Spiral QCT, and all the variables combined respectively. On the same classification task, the baseline regression model using FN aBMD achieved an AUC-ROC of 0.69, demonstrating that incorporating radiomic features enhances predictive accuracy beyond relying solely on FN aBMD. Furthermore, the model demonstrated robust performance when trained and tested across different fracture types indicating its capability to discern general fracture susceptibility traits. Yet, a notable caveat of this study is its retrospective design. Given that the models were constructed using features from post-fracture scans, there is a potential that the model recognized characteristics of a healed fracture, rather than accurately forecasting future fracture risk.
While Atkinson et al. [37] utilized a range of advanced imaging modalities to forecast OVF risk, which may not be readily accessible in many clinical settings, Muehlematter et al. [36] utilized standard CT scans. Their study involved 2 approaches: first, a paired control study comparing vertebrae from 58 patients who developed OVFs (cases) against those from 58 matched controls. Secondly, they conducted a within-subject analysis to predict the specific vertebrae at risk of fracture. Utilizing open-source tools, the team derived 305 texture analysis features of which 29 were selected for inclusion in the final model. For benchmarking, a regression model using the mean Hounsfield unit of the vertebrae was set as a reference. While this baseline model achieved an AUC-ROC of 0.83 in predicting whether a patient would have an OVF or not, all the ML alternatives performed better, with the SVM achieving the highest classification performance with an AUC-ROC of 0.97. In comparison, 2 expert radiologists achieved AUC-ROCs of 0.48 and 0.57 suggesting predictions that were close to random chance. The second part of the study analyzed 2 consecutive CT scans of the 58 patients who developed an OVF. Intact vertebrae from the first scan were manually segmented and then categorized as either fractured or intact in the follow-up scan. In the context of this classification task, the baseline regression model achieved an AUC-ROC of 0.52 compared to the leading ML model, SVM, with an AUC-ROC of 0.64. These results show that while combining texture analysis with ML on clinical CT scans can strongly predict overarching OVF risks, pinpointing specific vertebrae at imminent risk of fracture remains challenging.
Dieckmeyer et al. [34] conducted a radiomic analysis of multidetector CT scans, focusing on the thoracolumbar spine of 32 patients, evenly split between cases and controls. The L1 to L3 vertebrae were automatically segmented through a deep learning algorithm from which 24 texture features, 2 FEA features, and volumetric BMD, were derived. These features were averaged across vertebrae L1–3 before a ROC-AUC was calculated for each feature and used as inputs to a logistic regression model. Among them, the texture feature correlation (AUC-ROC of 0.754) and volumetric BMD (AUC-ROC of 0.750) emerged as the strongest predictors of VFs; however, they only exhibited a moderate, statistically nonsignificant enhancement in predicting vertebral fracture risk beyond just BMD. This suggests the potential superiority of vertebra-specific parameters in fracture risk assessment compared to radiomic parameters that are averaged over all vertebrae of interest. A distinguishing feature of this study was its fully automated pipeline, streamlining the fracture risk prediction process.
In a departure from prior cross-sectional studies, Wang et al. [35] conducted a longitudinal study to investigate the role of CT-based radiomics in forecasting OVF risk. Of the 7,906 patients who had CT scans between 2016 and 2019 without a prior OVF, 72 developed OVFs by 2021. For comparison, 144 patients without OVFs were selected as controls. CT scans of the affected vertebrae in the OVF group and the corresponding vertebrae in controls were manually segmented and 1,316 features, comprised of first-order, texture-based and higher-order features, were extracted from each ROI. A LASSO model was used to identify the top 10 most predictive features of which 7 were selected in the final model. These features achieved AUC-ROCs ranging from 0.54 to 0.76. A Radscore was devised through a linear combination of these selected features. Analysis of clinical factors through a Cox proportional-hazards model found that the vertebral body’s CT value and the erector spinae muscle’s cross-sectional area were independent predictors of OVF risk. Finally, a nomogram combining the 3 independent factors was tested achieving a C-index of 0.82.
2. X-Rays
In contrast to the CT-centric radiomic strategies previously discussed, Kong et al. [38] turned to a deep learning paradigm to discern OVF risk from x-ray images. From a longitudinal cohort of 7,301 patients, a subset of 1,595 were selected. Of these, 1,416 were designated for training, with a further 5:1 subdivision for cross-validation and the remaining formed the test group. Each participant’s data consisted of 2 x-rays: an initial one for training and a subsequent one to determine outcomes. Kong et al.’s computational strategy was 2-fold with both phases leveraging CNNs for data-driven insights: the first for keypoint detection and the second for survival analysis. Initially, a HRNet-W32 model, pretrained on ImageNet, was fine-tuned for center point detection of the L1–5 vertebral bodies from which ROIs were extracted. For fracture risk prediction, 2 distinct models were developed: the Cox proportional hazard model, driven purely by clinical data, and a CNN-based DeepSurv model, which was trained using both clinical and x-ray data or just clinical information alone. In the testing phase, DeepSurv, when trained with both images and clinical data, outperformed both FRAX and CoxPH in C-index measurements (DeepSurv’s 0.612 versus FRAX’s 0.547 and CoxPH’s 0.594). Remarkably, even without clinical data, DeepSurv’s achieved a higher C-index (0.614) than that of FRAX (0.547). This study demonstrated that using deep learning, particularly with x-rays, can surpass the predictive capabilities of FRAX in assessing vertebral fracture risks. Notably, the research emphasized the importance of a time-to-event analysis, marking a distinct shift from many previous deep learning studies that primarily focused on cross-sectional patient classifications based on fracture incidences.
3. Dual Energy X-Ray Absorptiometry
In recent years, the utility of DXA scans has grown with the emergence of innovative metrics like TBS and BSI that offer enhanced fracture risk prediction capabilities. Exploring this potential, Nissinen et al. [39] conducted a study to ascertain whether deep learning could further enhance fracture risk prediction by gleaning more insights from DXA scans. Drawing from the OSTPRE dataset of 14,220 women, a subset of 2,949 was chosen for the analysis, among which 425 had encountered fragility fractures following their DXA scan. To serve as a benchmark, logistic regression models were developed using various predictors: BMD T scores from the lumbar spine and hip, TBS averages, and the patient’s age. The benchmark regression model achieved an AUC-ROC of 0.63 which compared to the CNN’s AUC-ROC of 0.63 indicates that the CNN was not able to do better than a simple regression. The limited efficacy of the CNN model might stem from challenges like insufficient training data and an imbalanced dataset. Nonetheless, the CNN’s heatmap and gradient visualizations highlighted the vertebrae, indicating its ability to recognize genuine anatomical features (Tables 1, 2).
Summary of studies included in the literature review
Modified minimum information about clinical artificial intelligence modeling checklist (MI-CLAIM) for included studies
DICUSSION
OVFs are a significant health concern due to their association with increased morbidity, mortality, and diminished quality of life [7-9,11]. Historically, the primary method for assessing OVF risk has been BMD [14,21]. However, BMD measurements, while informative, capture only a fraction of the risk profile. They fail to account for other key determinants of bone strength, such as bone quality and architecture. In response to these limitations, newer metrics like TBS and BSI have been introduced that aim to provide a more comprehensive assessment of bone health alongside tools like FRAX that integrate clinical information [23,25,27,29]. Yet, despite these advancements, a significant gap persists in the early identification and effective management of individuals at high risk for OVFs.
1. Accessibility
In recent years, CV has advanced the field of OVF prediction by allowing for more granular and thorough analysis of medical images. Unlike traditional approaches that analyze an image based on a few select values or broad trends, CV can utilize information from every pixel in the image to draw powerful and robust insights.
One of CV’s most promising aspects is its capability to process and provide predictions using imaging techniques beyond just DXA scans. A majority of current OVF risk assessment measures heavily depend on DXA scans, a concerning fact given that only roughly 23% of individuals receive the recommended DXA screenings [24]. CV has demonstrated its potential by analyzing more commonly available scans, such as CTs and x-rays [34-38]. Furthermore, several studies highlighted in this review have not only used more commonly available scans but have leveraged opportunistic scans for fracture risk prediction, eliminating the need for specialized examinations or additional patient appointments [35,36,38]. This approach not only promotes efficient utilization of existing medical resources but is also cost-effective, minimizes redundant radiation exposure, and emphasizes patient safety and convenience.
However, a significant obstacle in the practical application of CV in clinical settings is the challenge of integrating these models into everyday practice. None of the models reviewed in our paper were incorporated into the electronic medical record (EMR) system, a step crucial for facilitating their adoption in clinical practice. Several hurdles complicate this integration including the variability of EMR systems across different healthcare facilities, compliance with data privacy laws, and the need for substantial computational resources. With effective integration, CV has the potential to simplify clinical workflows by automating the generation of OVF risk scores from scans already in the database. Furthermore, by integrating CV models into the EMR system, these models can more easily be validated and refined as clinicians can provide feedback in a continuous manner. The journey towards successful integration of CV models into EMR systems is complex and requires addressing various technical, regulatory, and practical challenges. However, the resulting improvements in patient care and clinical efficiency make this endeavor a crucial and worthwhile pursuit for the future of healthcare.
2. Data Dependence
The integration of CV in predicting OVFs is indeed a promising stride forward, but its adoption is not without challenges. A prevalent concern is the reliance of many models on cross-sectional and retrospective data [34,36,37,39]. This reliance can affect a models’ reliability and external validity. To mitigate these issues, it is vital to conduct prospective studies that validate the models on novel, unseen data. Moreover, the efficacy of CV algorithms, particularly deep learning models, hinges on the quality and variety of the training data. Training on limited or homogenous datasets can lead to overfitting, where a model excels in handling known data but performs poorly on new data. This challenge underscores the importance of robust validation techniques like k-fold cross-validation and the use of holdout test datasets. All the studies reviewed in this paper utilized a holdout test dataset on which they tested the model’s performance. However, only 3 studies utilized a k-fold cross-validation strategy [36,38,39].
3. Model Interpretability
Model interpretability is a fundamental aspect in the adoption and effective deployment of predictive tools, particularly in sensitive domains like healthcare. In simpler models, such as linear regression, the relationship between variables is straightforward; however, this clarity diminishes when we delve into the realm of large deep learning algorithms, which may have hundreds of thousands of parameters. In such complex models, tracing how input X influences the output becomes a challenging task. Even though deep learning algorithms like CNNs show the most promise, their lack of interpretability hinders their adoption. A notable example includes “shortcut learning” in which a classifier uses irrelevant information (i.e., color of the sky) to correctly predict the task at hand (i.e., distinguishing between a cat or a dog). Such instances underscore the importance of understanding not just whether a model works, but how and why it works, to ensure its reliability and generalizability across diverse real-world scenarios.
Interpreting deep learning models in healthcare goes beyond understanding their mechanics; it also involves recognizing potential biases ingrained in the training data. Medical datasets are inherently diverse, reflecting variations across ethnicity, age, sex, socioeconomic status, and other demographic factors. If a model is trained on data that overrepresents certain groups or underrepresents others, it may inadvertently learn and perpetuate these biases, rather than accurately identifying susceptibility characteristics. Among the included studies, there were differences in sex and ethnicity across studies and often lack of diversity within studies. For example, Nissinen et al. [39] utilized the OSTPRE cohort which is comprised entirely of Finnish women. Meanwhile, Wang et al. [35] and Dieckmeyer et al. [34] do not explicitly state racial/ethinc demographics but given that both studies recruited patients from their own hospital, the demographics likely represent the local community which would be largely Asian and Caucasian respectively. Given the known differences in osteoporotic compression fractures across different races, there may be different radiographic features that are predictive in one racial cohort but not another [40]. Additionally, included studies used training data from cohorts with varying sex splits: Nissinen et al. [39] 100% female, Wang et al. [35] 76% female, Dieckmeyer et al. [34] 50% female, and Muehlematter et al. [36] 43% female. Although osteoporosis affects females more than males, prevalence of VFs may be similar across sex, so it is unclear how using a cohort that is majority female affects generalizability of radiographic features [41,42]. In addition to identifying bias in the model via interpretability techniques, training models on largescale collaborative datasets that span multiple institutions and countries can also minimize the impact of bias. These datasets provide a rich and diverse range of demographics, patient histories, and clinical scenarios, ensuring the model’s adaptability and accuracy across different populations and healthcare settings. No included study had patients form multiple countries, and most did not describe specific racial breakdowns of the included patient populations.
Efforts to enhance the interpretability of deep learning models have led to the development of several innovative techniques. Key among these are SHAP (SHapley Additive exPlanations), LIME (Local Interpretable Model-agnostic Explanations), and Grad-CAM (Gradient-weighted Class Activation Mapping). These methods are just a few from a broad array of approaches designed to understand the inner workings of what is often referred to as the “black box” of deep learning. By shedding light on the decision-making processes of deep learning models, these techniques mark an important step in making complex CV systems more understandable and transparent. However, despite these advancements, our review of current literature reveals that only a handful of studies have effectively employed well-defined interpretability methods [38,39].
Ultimately, clinical decision-making is a nuanced and multifaceted task. For ML and deep learning models to be effectively integrated into this domain, they must not only be accurate but also transparent and interpretable. A thorough understanding of deep learning models is essential for building trust and ensuring their alignment with established clinical expertise and practices. Currently, these models are not at a stage where they can autonomously make clinical decisions. At present, their role is more supportive, enhancing physicians’ decision-making processes by offering additional insights and perspectives. The journey towards making these models mainstream in healthcare is ongoing, and addressing these challenges of trust, liability, and justice is a critical part of this journey.
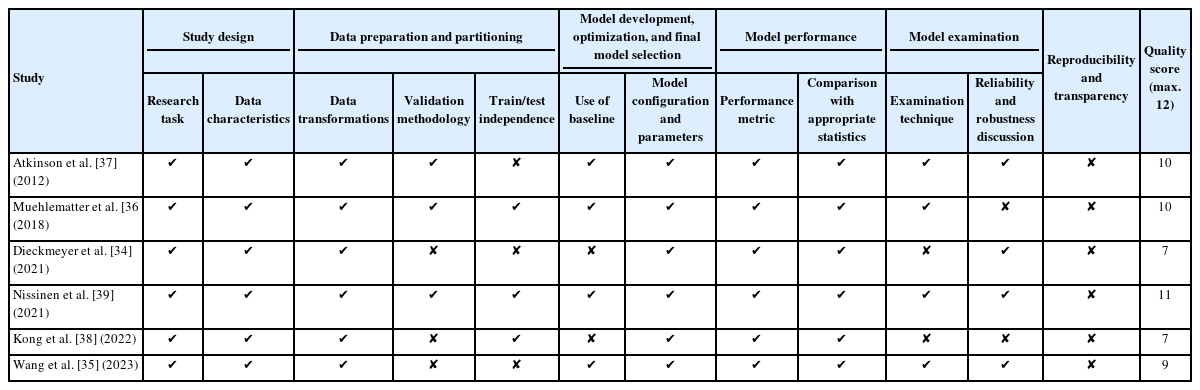
In this study, we attempted to assess the quality and sources of bias in the included studies by using a modified minimum information about clinical artificial intelligence modeling checklist (MI-CLAIM) as reported in Norgeot et al. [43] and Smets et al. [44] All studies did an adequate job of identifying the clinical problem, describing basic data collection, and data manipulation prior to development. Three of the included studies did not directly discuss model validation with internal or external validation, which may limit generalizability and reproducibility of results [34,35,38]. Additionally, 3 studies did not clearly explain train or test parameters or in the case of Atkinson et al. they did not specify partitioning when the models were trained on VFs and then tested on the same set [34,35,37]. Lack of transparency may artificially inflate results and reduce the model’s external validity. All studies identified model parameters and used appropriate statistical methods based on the model; however, in 2 studies which utilized deep learning methods, there was limited sensitivity analysis done to determine salient primary or higher-order features that drove model performance [36,38]. Finally, no study described access of code or data to reproduce results, providing a major hindrance to external validation and generalizability of all studies. These aspects of the studies must be addressed prior to wider clinical use.
4. Future Directions
The future of CV in healthcare is set to undergo a significant transformation. Currently, ML models are preferred for their effectiveness with smaller datasets and superior interpretability. Yet, the potential of more powerful deep learning models (i.e., 3D-CNNs, transformers, etc.) for improved accuracy is immense. These models have been proven to work significantly better in a variety of medical imaging contexts [45,46]. However, their adoption is limited by high data demands. An essential move towards employing these advanced neural networks involves developing extensive, cross-institutional datasets. These datasets will mitigate training data biases and provide the extensive data necessary for these networks to learn effectively. This development will unlock the full potential of sophisticated neural network architectures, enhancing accuracy and reliability in CV applications for OVF prediction. Further, integrating these models into EMR systems, improving their interpretability, and continuously evaluating their long-term effectiveness are essential for incorporating them into standard clinical practice. This integration signifies a transformative step in healthcare workflows, making advanced tools an integral part of medical care and heralding a new era where state-of-the-art technology and healthcare converge.
CONCLUSION
The use of CV for OVF prediction will provide an invaluable tool for both patients and physicians. The integration of CV and artificial intelligence into predictive models offers a transformative path to early detection and intervention. This comprehensive review underscores the potential of these advanced computational tools to harness the rich data embedded within medical images, extracting insights often beyond human perception. Such advancements not only optimize existing medical resources but also pave the way for greater patient safety, reduced costs, and enhanced convenience.
Notes
Conflict of Interest
The authors have nothing to disclose.
Funding/Support
This study received no specific grant from any funding agency in the public, commercial, or not-for-profit sectors.
Author Contribution
Conceptualization: AKA, AA, ARF, AER; Data Curation: AKA, AA; Methodology: AKA, AA, ARF, AER; Writing – Original Draft: AKA; Writing – Review & Editing: AKA, AA, ARF, AER.