Development and Validation of an Online Calculator to Predict Proximal Junctional Kyphosis After Adult Spinal Deformity Surgery Using Machine Learning
Article information
 , Dae-Jean Jo2, Jae Keun Oh3, Seung-Jae Hyun4, Jin Hoon Park5, Kyung Hyun Kim6, Jun Seok Bae7, Bong Ju Moon6,8, Chang-Kyu Lee9, Myoung Hoon Shin10, Hyun Jun Jang6, Moon-Soo Han8, Chi Heon Kim1, Chun Kee Chung1, Seung-Myung Moon,11, for the Korean Spinal Deformity Society
Abstract
Objective
Although adult spinal deformity (ASD) surgery aims to restore and maintain alignment, proximal junctional kyphosis (PJK) may occur. While existing scoring systems predict PJK, they predominantly offer a generalized 3-tier risk classification, limiting their utility for nuanced treatment decisions. This study seeks to establish a personalized risk calculator for PJK, aiming to enhance treatment planning precision.
Methods
Patient data for ASD were sourced from the Korean spinal deformity database. PJK was defined a proximal junctional angle (PJA) of ≥ 20° at the final follow-up, or an increase in PJA of ≥ 10° compared to the preoperative values. Multivariable analysis was performed to identify independent variables. Subsequently, 5 machine learning models were created to predict individualized PJK risk post-ASD surgery. The most efficacious model was deployed as an online and interactive calculator.
Results
From a pool of 201 patients, 49 (24.4%) exhibited PJK during the follow-up period. Through multivariable analysis, postoperative PJA, body mass index, and deformity type emerged as independent predictors for PJK. When testing machine learning models using study results and previously reported variables as hyperparameters, the random forest model exhibited the highest accuracy, reaching 83%, with an area under the receiver operating characteristics curve of 0.76. This model has been launched as a freely accessible tool at: (https://snuspine.shinyapps.io/PJKafterASD/).
Conclusion
An online calculator, founded on the random forest model, has been developed to gauge the risk of PJK following ASD surgery. This may be a useful clinical tool for surgeons, allowing them to better predict PJK probabilities and refine subsequent therapeutic strategies.
INTRODUCTION
Adult spinal deformity (ASD) surgery primarily aims to restore and maintain spinal alignment [1,2]. However, proximal junctional kyphosis (PJK), a well-known complication of ASD surgery, may occur. PJK occurs in 17%–39% of ASD cases; one cause of PJK is regarded to be inappropriate curve correction [3]. Among the PJK, can have catastrophic consequences. In addition to neurological impairment, the potential requirement of revision surgery and a marked increase in treatment costs can also ensue [1]. To avoid these adverse outcomes, it’s imperative to consider both the baseline sagittal alignment and compensation strategies by the pelvis and lower extremities. Over time, various scoring systems aimed at predicting PJK have been proposed [1,4].
In the past decade, noteworthy contributions to this field have been made by the International Spine Surgery Group (ISSG) and the European Spine Study Group (ESSG). ISSG introduced the Scoliosis Research Society (SRS)-Schwab classification and the sagittal age-adjusted score (SAAS) [1]. ESSG established global alignment and proportion (GAP) scores [4]. This approach enhances postoperative outcomes and minimizes the risk of mechanical failure [1,4-6]. Although these approaches differ in their method of development, they share similar key variables, including age, pelvic incidence (PI), lumbar lordosis (LL), pelvic tilt (PT)/sacral slope, and global tilt/T1-pelvic-angle [1,4]. The reported scoring systems allow for the categorization of individual patients into 3 groups of undercorrected, matched, and overcorrected; or proportioned, mildly disproportioned, and severely disproportioned. However, this tripartite classification of PJK risk following ASD surgery did not offer clinicians sufficient information to guide subsequent treatment decisions. Thus, there’s an unmet need for a personalized risk calculator for PJK that encompasses postoperative values and baseline characteristics.
Recent advances in artificial intelligence (AI) such as machine learning (ML) and deep learning techniques, are tailor-made for understanding complex datasets. These algorithms excel in recognizing patterns from training data, allowing for individualized patient-level predictions.
These algorithms may be beneficial for calculating the risk of PJK wherein various factors are complexly intertwined. The aim of this study was to develop an accurate ML model to predict the risk of PJK in patients with ASD. The best model was deployed as a web-based calculator, allowing spine surgeons to further develop individualized treatment plans.
MATERIALS AND METHODS
1. Data and Study Population
This investigation was retrospectively conducted using the Korean spinal deformity database. The participating 16 centers operated under Institutional Review Board approval with patient consent obtained prior to enrollment and data collection. The data was collected from 2011 to 2020 with radiographic evidence of ASD defined as ≥ 18 years of age, sagittal vertical axis (SVA) ≥ 50 mm, PT ≥ 25°, PI minus LL (PI–LL) mismatch > 10°, or thoracic kyphosis (TK) ≥ 60° [7]. Among the patients with ASD, those who underwent deformity correction and were followed up minimum 1 year were included in this investigation. Patients were excluded if they had coronal deformity only, underwent < 3 level fusion surgery, or missed key spinopelvic parameters.
2. Data Definition and Collection
PJK was defined as meeting either of the following criteria at the final follow-up: a proximal junctional angle (PJA) of ≥ 20°, or an increase in PJA of ≥ 10° compared to the preoperative values [8]. PJA is defined as the sagittal Cobb angle between the lower end plate of the upper instrumented vertebra (UIV) and the upper end plate of the UIV+2. The primary outcome for this investigation was PJK occurrence at the final follow-up.
Demographic data of eligible individuals were collected, comprising age, sex, body mass index (BMI), underlying disease, bone mineral density (BMD), deformity type, SRS-Schwab variables, PI, LL, PT, TK, SVA, fusion level, and sacroiliac fixation. The difference in PI–LL was evaluated as the actual postoperative alignment compared with the ideal target alignment. Previously published formulas for ideal age-adjusted PI–LL were as follows [8]:
Classifications were as follows: (1) A match was identified when the disparity between the ideal PI–LL and the postoperative PI–LL was within ± 10°. (2) Variances less or greater were labeled as undercorrection and overcorrection, respectively.
3. Statistical Analysis
Data were presented as frequencies with percentages for categorical variables and as means with standard deviations (SDs) for continuous variables. Continuous variables were compared using the Mann-Whitney U-test, and categorical variables were compared using the chi-square test. Binomial logistic regression analyses were used to predict the risk of PJK, and then backward stepwise selection was subsequently performed to identify variables for the multivariable logistic regression models based on statistical significance in the univariable analysis. Variables significant at the α ≤ 0.20 level on univariable analyses were included in a stepwise multivariable logistic regression model for each outcome of interest. Variables were included in the final model if they were significant at the α ≤ 0.05 level.
Apart from conventional statistical methodologies, we also conducted a predictive assessment employing AI, as illustrated in Fig. 1. Input data incorporated variables of statistical importance from our study and age—a recognized risk determinant in both the GAP score and SAAS. The outcome was PJK risk. Patients with missing values were excluded from the analysis, and missing values were not replaced with calculated estimates. The included cohort was randomly split into a training and test set at a 70:30 ratio. We utilized K-fold cross validation on the training dataset for preprocessing optimization and hyperparameter tuning. After the cross validation, we employed a value of 5 for K as a hyperparameter and identified the optimal values for C and sigma (γ) as 1. The C hyperparameter is responsible for controlling the trade-off between maximizing the margin and minimizing the training data’s classification inaccuracy. For support vector machine (SVM) models utilizing the sigmoid basis function kernel, sigma ascertains the kernel’s spread, particularly pivotal for handling data that isn’t linearly separable.
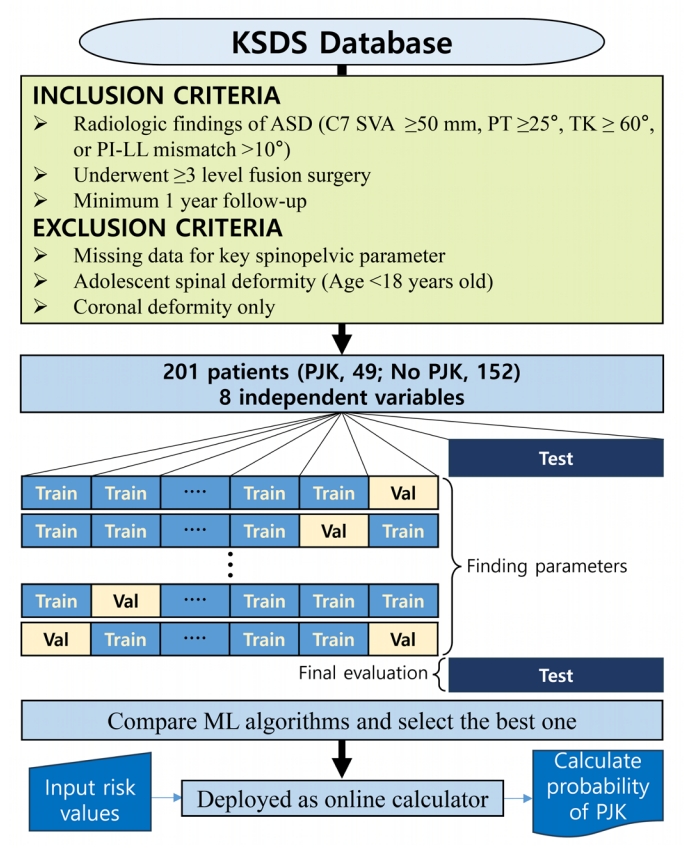
Overview of the investigation process using machine learning. KSDS, Korean spinal deformity database; PI–LL, pelvic incidence minus lumbar lordosis; ASD, adult spinal deformity; SVA, sagittal vertical axis; PT, pelvic tilt; TK, thoracic kyphosis; PJK, proximal junctional kyphosis; ML, machine learning
Post hyperparameter optimization, algorithms were trained on the entire training dataset and assessed on the test set. This test set remained untouched during preprocessing and hyperparameter adjustment phases. Five ML and statistical algorithms, namely SVM, random forest (RF), linear discriminant analysis, classification and regression tree, and K-nearest neighbors (KNN) were employed to predict individual PJK risk post-ASD surgery. The KNN model used 10 as its K hyperparameter value. After model development, we compared their performance metrics: the area under the receiver operating characteristic (AUROC) curve, F1-score, and the confusion matrix. The most accurate model, based on both model accuracy and AUROC, was subsequently chosen to develop an online interactive tool.
Statistical analyses were conducted using R ver. 4.3.1 (R Foundation for Statistical Computing, Vienna, Austria) and IBM SPSS Statistics ver. 25.0 (IBM Co., Armonk, NY, USA). In R-programming, we used the Caret, e1071, randomForest, caTools, lattice, ggplot2, Rcurl, and ggplot2 packages [9]; the application was built and deployed using the Shiny package and server [10].
RESULTS
We enrolled a total of 201 patients in this study. During the follow-up period, 49 patients (24.4%) exhibited PJK. The baseline characteristics of the study population are summarized in Table 1. The mean ± SD age at the time of surgery was 67.16 ± 9.08 years. Notably, 78.6% of these patients were female. Additionally, participants had a mean BMI of 24.71 ± 3.94 kg/m2 and a BMD of -1.04 ± 3.12. After deformity correction, 50 patients (42.0%) achieved the matched ideal age-adjusted PI–LL. Meanwhile, 53 (44.5%) were undercorrected and 16 (13.4%) were overcorrected in relation to the age-adjusted PI–LL. The univariable analysis revealed a significant association between the PJK and no-PJK groups for several factors: PJA at the immediate postoperative state (p = 0.007), BMI (p = 0.029), SRS-global balance modifier (p = 0.090), SRS-PI–LL modifier (p = 0.097), SRS-curve pattern (p = 0.105), deformity type (p = 0.184), PI (p = 0.196), thoracolumbar alignment at the immediate postoperative state (p = 0.176), and hypertension (p = 0.132). All these associations met the criterion of α ≤ 0.20, as detailed in Table 1. In the multivariable analysis, postoperative PJA (odds ratio [OR], 0.942; p = 0.034), BMI (OR, 0.883; p = 0.046), and deformity type (OR, 1.655; p = 0.049) were found to be statistically significant (p < 0.05) (Table 2). The explanatory powers of the models were low, with an adjusted R2 of 18.8%.

Baseline characteristics of the study population and univariate analysis of risk factors for proximal junctional kyphosis after adult spinal deformity surgery

Multivariable standard least square analysis to evaluate independent risk factors for proximal junctional kyphosis after adult spinal deformity surgery
Our ML models’ training drew from the results of the univariable analysis, which included: deformity type, BMI, SRS-curve pattern, SRS-PI–LL modifier, SRS-global balance modifier, PI at baseline, PJA at immediate postoperative state, and age, a variable with renowned significance. Thoracolumbar alignment could not include the ML models due to missing data. Among the 5 ML models we assessed, the RF model proved to be the most accurate with a score of 0.83, closely followed by the SVM model at 0.79, as presented in Table 3. In terms of the AUROC curve, the RF model achieved 0.76, outperforming the SVM model’s 0.64, as depicted in Fig. 2. The RF model had an F1 score of 0.67 and a sensitivity rate of 0.57, marking the highest scores among all 5 ML models we evaluated. Using these predictors and models, we derived the likelihood of PJK based on the assessed variables, leading us to design a user-friendly calculator. This tool is illustrated in Fig. 3 and can be accessed at: (https://snuspine.shinyapps.io/PJKafterASD/). As an illustrative example: a 70-year-old patient diagnosed with degenerative spinal deformity, possessing a BMI of 27 kg/m2, a PI of 60°, PI–LL of 15°, SVA of 50 mm, and a postoperative PJA of 5°, would have an estimated 13.81% probability of developing PJK.

Comparison of classification model performance metrics
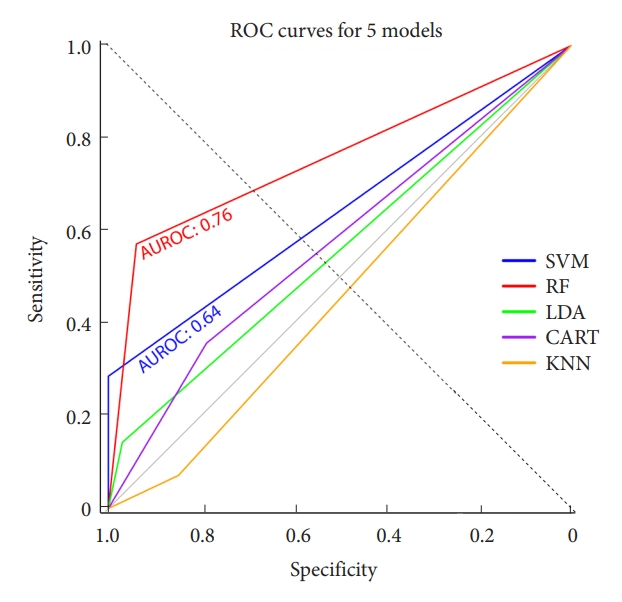
The receiver operating characteristic (ROC) curves were plotted for 5 machine learning models. Among these models, the random forest (RF) exhibited the highest area under the ROC (AUROC) curve with a value of 0.76, followed by the support vector machine (SVM) with an AUROC of 0.64. On the other hand, the AUROC values for linear discriminant analysis (LDA), classification and regression tree (CART), and K-nearest neighbors (KNN) were all below 0.6.
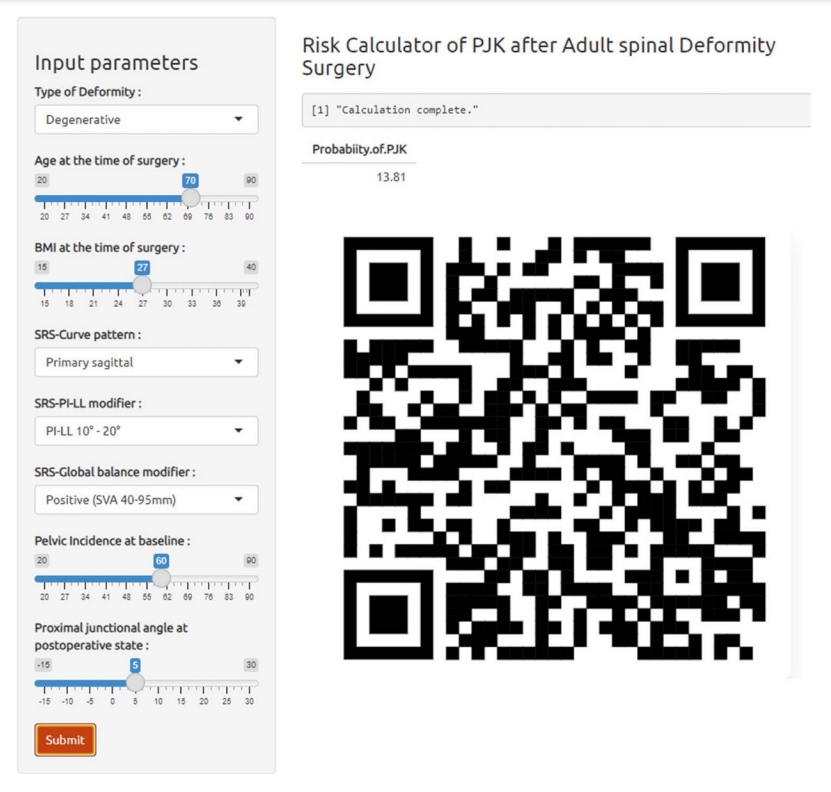
Illustration of the online calculator of the proximal junctional kyphosis predictive model. All variables are based on univariable analysis and age factors. This application is available at https://snuspine.shinyapps.io/PJKafterASD/ or by scanning the QR code.
DISCUSSION
This study was utilized the conventional multivariable logistic regression to assess the risk of PJK. Concurrently, we developed and launched an ML model as an interactive online calculator to predict personalized PJK risk following ASD surgery. The multivariable analysis demonstrated PJA, BMI, and deformity type as significant independent predictors for PJK. While classical statistical methods highlight potential PJK risks based on these variables, its explanatory power is low and clinical settings necessitate a more personalized risk evaluation for patients exhibiting these factors. Hence, we created an ML model whose AUROC and accuracy were 0.76 and 83.0%, respectively. This model was deployed as a freely available, interactive online calculator that calculates the individual risk of PJK using select variables.
Over the past decade, there has been intermittent introduction and subsequent disappearance of diverse scoring mechanisms intended for the prevention of PJK [1]. A review indicated that published literature did not corroborate the excellent outcomes as reported in the original GAP score article [11]. They addressed that the AUROC of 7 of 10 articles ranged from 0.5 (same as random selection) to 0.68 (insignificant value as a diagnostic tool) [11]. Previous scoring systems were the aggregate of values derived from first-order functions. The inclination towards first-order functions arose more from their simplicity than their precision [1,4,11-15]. Considering the intricate interplay of factors influencing spinal sagittal alignment, including the whole spine, pelvis, age-related alignment adjustments, and compensatory mechanisms, a simple first-order function seems insufficient. AI-driven computations, equipped with sophisticated analyses involving advanced mathematical techniques encompassing multivariable and higher-order functions, are suggested to surpass classical regression analyses in terms of accuracy. Earlier studies using AI models for predicting PJK or similar complications achieved AUROC values in the range of 0.8 to 0.9 [6,14]. Our study developed with an RF-based ML model achieved an AUROC of 0.76, demonstrating its diagnostic value in predicting PJK after ASD surgery.
In a previous study, it was noted that approximately 70% of patients failed to achieve a ‘proportioned’ spinopelvic state based on GAP score, even after undergoing deformity correction and analyzing ISSG data [1,16]. This observation suggests that the 70% carried a risk of 47% or 95% for revision surgery due to mechanical complications based on the original GAP study [4]. Spine surgeons calculate the risk of reoperation for those patients and recommend revision surgery preemptively for those at high risk. However, with the current 3-tier risk classification, there is insufficient information to guide decisions regarding revision surgery. Despite being reported to possess high diagnostic power, previous AI-driven PJK prediction models had limited accessibility and were unable to calculate individualized risk of PJK [6,14]. Our research diverges from previous studies by facilitating PJK risk quantification via the assimilation of patient-specific variables, resulting in a bespoke numerical risk score. This tool may help to enhance clinicians’ efficacy in patient consultations about PJK risks, obtaining informed consent, and guiding spine surgeons in decision-making to avert PJK.
In previous investigations conducted by ISSG and ESSG, several variables including age, PI, LL, PT, BMI, and BMD were suggested as potential determinants of PJK risk. However, our study identified only PJA, BMI, and deformity type as statistically significant factors in multivariable analysis. Notably, age and BMD, commonly recognized as PJK risk factors, did not exhibit significant disparities in our study. This disparity could be attributed to the demographics of our patient population. The ISSG and ESSG studies encompassed a diverse racial composition, including Caucasians, African Americans, Hispanics, and fewer Asians. Our study only included the Korean population in the Republic of Korea, resulting in a smaller yet racially homogeneous patient cohort. The discrepancies between our findings and previous research highlight the need for further exploration through comprehensive future studies.
Several limitations warrant consideration in interpreting the findings of our study. Firstly, the utilization of a retrospective database from multiple centers and a long enrollment period presents challenges. The long enrollment duration may introduce variations due to the evolution of surgical techniques, materials, and targeted alignments over time. Furthermore, while the multi-institutional nature of the database offers a broad perspective, patient selection and surgical approaches might differ across institutions. However, it’s worth noting that retrospective databases often serve as valuable resources for analysis in this field, given the infrequent occurrence of deformity corrections and the enhanced generalizability the results afford. Secondly, variables with α ≤ 0.2 in the univariable analysis were included in the multivariable analysis. While the value of 0.05 is traditionally considered statistically significant, it is not an absolute threshold. The α-value represents the maximum type 1 error probability based on the sample mean value. Given this context, controlling the α-value (type 1 error) is a common approach, with other studies often setting an α-value criterion of less than 0.1–0.2 [17,18]. Furthermore, unlike conventional statistical methods, AI-driven research sometimes adopts a broader p-value range, particularly when analyzing complex interactions between multiple variables, as seen in our study focused on PJK. Thirdly, our analysis relied solely on baseline patient characteristics and their radiologic parameters. Clinical outcomes were excluded due to the considerable amount of missing data in our database. Because radiological evidence of PJK does not necessarily correlate with unfavorable clinical outcomes, the observed PJK rate in our study might potentially be higher than the actual bad clinical outcomes.
CONCLUSION
This study suggests that PJA, BMI, and deformity type could be noteworthy independent predictors for PJK based on multivariable analysis. Leveraging AI methodologies, we constructed a ML model that exhibited good capabilities in predicting PJK risk following ASD surgery. This model could potentially provide valuable insights for customizing extended treatment strategies for patients who have not attained their desired spinal alignment post-surgery.
Notes
Conflict of Interest
The authors have nothing to disclose.
Funding/Support
This study received no specific grant from any funding agency in the public, commercial, or not-for-profit sectors.
Author Contribution
Conceptualization: CHL, DJJ, JKO, SJH, SMM; Data curation: DJJ, JKO, SJH, JHP, KHK, JSB, BJM, CHL, MHS, HJJ, MSH; Formal analysis: CHL; Methodology: CHL; Project administration: SMM; Writing - original draft: CHL; Writing - review & editing: DJJ, JKO, SJH, JHP, KHK, JSB, BJM, CHL, CHK, CKC, SMM.