Severe Preoperative Disability Is Associated With Greater Mental Health Improvements Following Surgery for Degenerative Spondylolisthesis: A Cohort Matched Analysis
Article information

Abstract
Objective
To evaluate preoperative disability’s influence on patient-reported outcomes (PROs) following surgery for degenerative spondylolisthesis (DS).
Methods
DS patients who underwent surgical intervention were retrospectively identified from a single-surgeon spine registry. Cohorts based on Oswestry Disability Index (ODI) < 41 (milder disability) and ≥ 41 (severe disability) were created. Demographic differences were accounted for with 1:1 propensity score matching. For the matched sample, perioperative and PRO data were additionally collected. PROs assessed included mental health, physical function, pain, and disability. Pre- and up to 2-year postoperative PROs were utilized. Average time to final follow-up was 15.7 ± 8.8 months. Improvements in PROs and minimal clinically important difference (MCID) rates were calculated. Continuous variables were compared through Student t-test and categorical variables were compared through chi-square tests.
Results
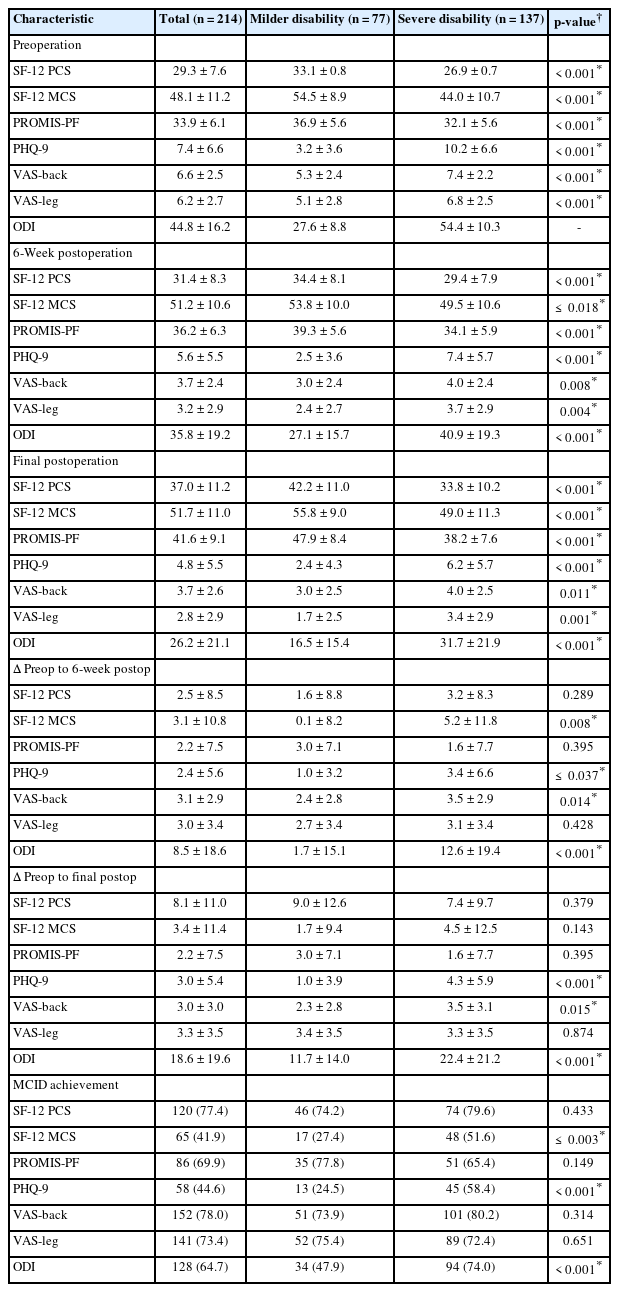
Altogether, 214 patients were included with 77 in the milder disability group. The severe disability group had worse postoperative day (POD) 1 pain scores and longer hospital stays (p ≤ 0.038, both). The severe disability group reported worse outcomes pre- and postoperatively (p < 0.011, all), but had greater average improvement in 12-item Short Form health survey mental composite score (SF-12 MCS), 9-Item Patient Health Questionnaire (PHQ-9), visual analogue scale (VAS)-back, and ODI by 6 weeks (p ≤ 0.037, all) and PHQ-9, VAS-back and ODI by final follow-up (p ≤ 0.015, all). The severe disability cohort was more likely to achieve MCID for SF-12 MCS, PHQ-9, and ODI (p ≤ 0.003, all).
Conclusion
Patients with greater baseline disability report higher POD 1 pain and discharge later than patients with milder disability. While these patients report inferior physical/mental health before and after surgery, they report greater improvements in mental health and disability postoperatively.
INTRODUCTION
Spondylolisthesis occurs when a vertebrae slips anteriorly as compared to an adjacent vertebrae [1]. This slippage can cause symptoms such as radiculopathy or mechanical pain and depending on the degree of slippage can be very disabling [2]. Spondylolisthesis most often occurs in the lumbar spine at the L4/L5 and L5/S1 joints and can have several etiologies [3]. Of interest is degenerative spondylolisthesis (DS) as unlike isthmic or traumatic spondylolisthesis, the anterior slippage of the vertebrae is not due to defect/fracture in the pars interarticularis, but rather degenerative changes in the spine [3].
DS most commonly affects adults, specifically females and obese patients [3]. Treatment of this condition varies based on severity and can range from conservative management with nonsteroidal anti-inflammatory drugs to surgical repair [4]. Surgical treatment entails different combinations of decompression, interbody fusion, or laminectomy, with the aim to provide stability to the vertebrae [5].
Outcomes can vary based on several preoperative factors, especially preoperative disability. Several studies have found that higher levels of preoperative disability can negatively affect surgical outcomes after lumbar spine surgery [6,7]. One such outcome is mental health, and with the correlation between mental health and other outcomes such as surgical satisfaction, it is important to explore this association [8,9]. However, the effect of preoperative disability on these patient outcomes has not been evaluated specifically in the context of DS. Understanding this relationship is crucial in informing patient selection and education, especially for a pathology with several treatment options [10].
Thus, the goal of this study will be to understand how preoperative disability affects surgical outcomes after surgical intervention for DS.
MATERIALS AND METHODS
1. Patient Population
A retrospective query of a prospectively maintained single spine surgeon’s database was used to collect patient data. Inclusion criteria consisted of patients undergoing primary elective surgical intervention for DS. Exclusion criteria consisted of patients undergoing surgery for nonelective etiologies such as cancer, trauma, or infection. Patients in this study underwent surgery between October 2013 to October 2022. All data for this current study were obtained with patient consent. Institutional Review Board approval was obtained prior to the start of this study (ORA #14051301).
2. Data Collection
Data on demographic, perioperative characteristics, and patient-reported outcomes (PROs) were assessed. Demographic data included patient age, self-identified gender, body mass index (BMI), comorbidities (smoking, hypertension, and diabetes), American Society of Anesthesiologists (ASA) physical status classification, Charlson Comorbidity Index score, and insurance type.
Perioperative characteristics assessed were number of levels operated, operative time (minutes), estimated blood loss (mL), length of stay (LOS, hours), and several acute postoperative measures. These included acute postoperative visual analogue scale (VAS) pain for postoperative day (POD) 0 and 1, postoperative narcotic consumption on POD 0 and 1, and day of discharge, which ranged from POD 0 to 6.
PROs surveyed were Oswestry Disability Index, 12-item Short Form health survey (SF-12) mental and physical composite scores (MCS/PCS), Patient-Reported Outcome Measure Information System-Physical Function (PROMIS-PF), 9-item patient health questionnaire (PHQ-9), VAS-back (VAS-B), and VAS-leg (VAS-L). These surveys were administered preoperatively, 6 weeks postoperatively (6-Week Post-Op), and at the final postoperative follow-up (Final Post-Op). Average time to Final Post-Op was 15.7 ± 8.8 months.
3. Statistical Analysis
Using preoperative ODI scores, 2 cohorts were created: ODI score < 41 (milder disability) and ≥ 41 (severe disability). Inferential statistics were used to analyze demographic data to assess for any significant differences. Student t-tests were used for continuous variables and chi-square analysis was used for independent variables. Analysis revealed age, BMI, incidence of diabetes, and insurance type were significantly different between cohorts. 1:1 propensity score matching was then used to control for these significant differences. ΔPROs were then calculated by determining the raw change in PRO scores from preoperative baseline to 6-Week Post-Op and Final Post-Op timepoints. Student t-tests were used to compare PROs at the preoperative, 6-Week Post-Op, and Final Post-Op timepoints as well as ΔPROs. minimal clinically important difference (MCID) achievement rates were calculated by comparing individual patient improvement to previously defined cutoff values. These MCID cutoff values were obtained from prior literature and were—SF-12 MCS: 10.1, SF-12 PCS: 2.5, PROMIS-PF: 4.5, PHQ-9: 3.0, VAS-B: 2.1, VAS-L: 2.8, ODI: 14.9 [11-14]. Chi-square analysis was then used to compare MCID achievement rates between cohorts. All statistical analyses were performed using Stata 17.0 (StataCorp LP, College Station, TX). A p-value of < 0.05 was used to determine significance.
RESULTS
1. Descriptive Analysis
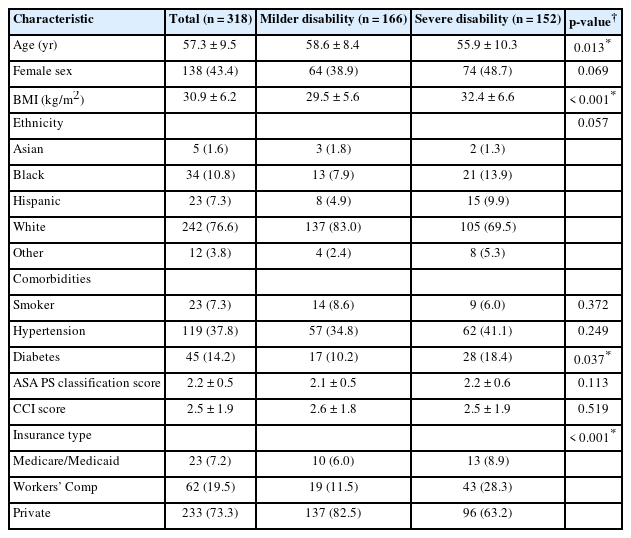
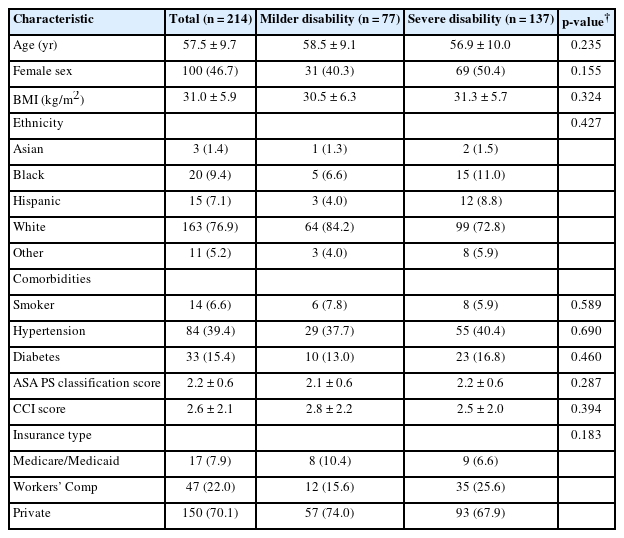
Three hundred and eighteen patients met inclusion criteria with 166 patients in the milder disability cohort before propensity matching. Analysis of demographic data revealed significant differences in age, BMI, incidence of diabetes, and insurance type. After controlling for these differences through 1:1 propensity score matching, 214 patients were included with 77 in the milder disability cohort. The study population had a mean age of 57.5 years, with 46.7% self-identifying as female, and an average BMI of 31.0 kg/m2. A majority of the population identified as Caucasian (76.9%) and reported having private insurance (70.1%).
Regarding perioperative characteristics, 90.2% of all patients had a 1-level operation, with a mean operative time of 138.8 minutes. While POD 0 VAS pain was similar amongst cohorts, the milder disability cohort reported superior VAS pain scores on POD 1 (p≤ 0.007). The milder disability cohort on average was also discharged earlier (p ≤ 0.038). Additional demographic data and perioperative characteristics can be referenced in Tables 1-3.
Unmatched patient demographics
Matched patient demographics

Matched perioperative characteristics
2. Patient-Reported Outcomes
Preoperatively the milder disability cohort reported superior outcomes in all PROs assessed (p < 0.001, all). At the 6-Week Post-Op and Final Post-Op timepoints this continued as the milder disability cohort reported superior scores in all PROs (p≤ 0.018, all). However, from preoperative baseline to 6-Weeks Post-Op the severe disability cohort experienced a greater magnitude of improvement in SF-12 MCS, PHQ-9, VAS-B, and ODI (p ≤ 0.037, all). From preoperative baseline to Final Post-Op, the severe disability cohort continued to report superior improvement in PHQ-9, VAS-B, and ODI. MCID achievement rates for SF-12 MCS, PHQ-9, and ODI were also higher for the severe disability cohort (p≤ 0.003, all). Additional information on PROs can be referenced in Table 4.
Patient-reported outcomes and minimum clinically important difference
DISCUSSION
This current study had several interesting findings. In the unmatched sample, the severe disability cohort was on average older, had a higher BMI, were more likely to be diabetic, and fewer patients had private insurance. Amongst the matched sample, the severe disability cohort reported higher VAS pain scores on POD 1 and on average had a longer hospital stay postoperatively. Preoperatively, the severe disability cohort reported inferior scores across all PROs in domains such as mental health, physical function, and pain scores. These inferior scores persisted throughout the entire postoperative follow-up period, which was an average of 15.7 months. However, preoperative disability did not hinder postoperative improvement in PROs and the severe disability cohort even reported superior improvement in mental health, pain, and disability domains from preoperative baseline to 6-Week Post-Op and Final Post-Op. Furthermore, the severe disability cohort reported higher rates of MCID achievement in mental health and disability PROs, indicating a significant and clinically tangible improvement in these domains.
Demographic differences in age, BMI, incidence of diabetes, and insurance type that were noted in the unmatched sample have been previously reported in spine literature. In a study evaluating the axial loading of patients with lumbar DS via magnetic resonance imaging, patients with more severe ODI scores were on average older (> 65 years) [15]. Another study evaluating lumbar DS patients after surgical repair found that higher preoperative ODI scores were also associated with higher BMI [16]. To control for these differences, 1:1 propensity score matching was utilized and a matched sample was created. In our patient population, the severe disability cohort experienced higher levels of pain on POD 1 and reported longer postoperative hospital stay. A study that evaluated predictive factors of perioperative outcomes in patients undergoing thoracolumbar spine surgery found that higher preoperative ODI scores were predictive of higher VAS pain scores. This relationship was noted for a variety of spinal pathologies including failed back surgery syndrome, spinal stenosis, and spondylolisthesis [17]. The greater postoperative pain may be due to patients with higher disability catastrophizing their perceived pain. In a study that evaluated patients with chronic lower back pain, it was found that patients with higher ODI scores were more likely to report higher pain scores [18]. ODI being predictive of a longer postoperative LOS has also been previously reported. A study that aimed to create a predictive model of postoperative complications found that high preoperative ODI scores were one of the most important factors in predicting a longer postoperative LOS following elective lumbar spine surgery [19]. Higher perceived pain could have also had a compounding effect on postoperative LOS as this was also a factor identified to increase hospital stay in patients undergoing spine surgery [19].
Beyond perioperative scores, this study also demonstrated the predictive value of ODI scores on both preoperative and postoperative PROs. Preoperatively, patients in the severe disability cohort reported inferior scores in all assessed PROs, including outcome measures in domains such as mental health, physical function, and pain. These findings indicate a relationship between disability and these domains, something which is well established in current spine literature. The inferior physical function scores were likely due to the previously defined relationship between ODI and PROMIS-PF and SF-12 PCS scores. This inherent correlation is due to the fact that ODI scores are based on physical function, a point validated by a study examining the relationship between these PROs in patients with lumbar disc herniation [20]. It has been demonstrated that spine patients with higher ODI scores report inferior pain scores prior to treatment regardless of age or sex, as higher ODI scores are indicative of more severe disease [21]. Furthermore, the correlation between ODI and mental health has been established in literature. While several factors can affect mental health, ODI can independently cause inferior mental health, as shown in a study which evaluated this relationship in the context of several other factors such as unemployment [22].
Postoperatively, the severe disability cohort continued to report inferior scores across all follow-up timepoints. This trend is supported across spine literature for a variety of spinal pathologies. In a study that aimed to define predictive factors for unfavorable outcomes after surgery for lumbar spine stenosis, it was found that higher preoperative ODI scores led to higher VAS-B, VAS-L, and ODI scores throughout a 3 year follow-up [23]. Another study that created predictive models for outcomes at 12 months post lumbar spine surgery found that severe preoperative disability as measured by ODI was highly predictive of inferior disability, quality of life, and pain scores [24]. The correlation between preoperative ODI scores and postoperative physical function scores, specifically PROMIS-PF, was also demonstrated by a study that evaluated spine surgery patients [25]. Furthermore, severe disability has been associated with inferior SF-12 MCS and PHQ-9 scores throughout all time points after spine surgery across both thoracic and lumbar spine segments [9].
However, regardless of the level of disability, all patients were able to experience similar improvements in PROs, with the severe disability cohort interestingly reporting superior improvement in mental health and disability domains. Similarly, prior studies have found that patients undergoing surgery for lumbar disc herniation and lumbar spinal stenosis with severe preoperative disability were more likely to experience a significant improvement in disability scores [23,26]. Several studies have also highlighted the effect of preoperative disability on specifically improvement in mental health. In a study evaluating improvements in mental health after elective spine surgery, the authors found that patients with higher ODI scores reported superior improvements in SF-12 MCS and PHQ-9 scores postoperatively. Reduction of depressive symptoms was also noted regardless of spinal pathology, however, the greatest improvement was noted in patients who presented with severe disability and spondylolisthesis [9].
Additionally, a study of disability and depression in patients with chronic back pain revealed that there was a moderate positive correlation between disability and depression. It was observed that severe disability was significantly hindering day-to-day life and social activity leading to severe depressive symptoms. Thus, improvement in disability, even to moderate disability, enabled partial/full return to normal activity and would offer improvement in mental health [27]. Another study which evaluated patients who underwent lumbar discectomy reported similar correlations between improvements in disability and depression and found that as disability improved so did depressive symptoms [28].
These improvements in mental health and disability were also evident in the higher rates of MCID achievement, indicating a clinically significant outcome for patients with severe disability. Studies have supported these findings, with one paper finding that patients with spondylolisthesis were more likely to achieve MCID in disability and mental health domains, indicating the ability for DS patients to improve [29]. Further studies have found that patients with worse preoperative ODI are more likely to achieve MCID in both ODI and health-related quality of life (a proxy used for mental health) after surgery for spinal deformity [30].
Thus, severe preoperative disability is correlated with inferior outcomes across mental health, physical function, pain, and disability domains. However, this does not limit the ability for these patients to experience similar levels of improvement in physical function and pain, but also superior improvement in mental health and disability. This magnitude of improvement is also clinically significant as evidenced by superior MCID achievement rates. As such, while DS patients with severe disability may not report superior outcomes, they can still greatly benefit from surgical intervention.
This study does have several limitations. A single-surgeon database was used to collect data and the study population was predominantly Caucasian and held private insurance. Thus, the generalizability of these findings may be limited. As such, for future studies a multi-site, multi-surgeon database should be utilized. PROs were also utilized to measure outcomes and these are inherently vulnerable to patient and recall bias. While demographic differences could have impacted this study, these confounding variables were mitigated via 1:1 propensity score matching.
CONCLUSION
Patients with greater baseline disability report higher POD 1 pain, and are more likely to discharge later than patients with milder disability. Patients with severe preoperative disability report inferior physical and mental health before and after surgery, but report greater improvements in mental health and disability after surgery.
Notes
Conflict of Interest
The authors have nothing to disclose.
Funding/Support
This study received no specific grant from any funding agency in the public, commercial, or not-for-profit sectors.
Author Contribution
Conceptualization: IK, FNA, AMR, AJS, VPF, GDL, KS; Data curation: IK, FNA, AMR, SSM, ACL, AK, JCW; Formal analysis: IK, FNA, AMR, JCW; Methodology: IK, FNA, AMR, AK, JCW, VPF, AJS, GDL, KS; Project administration: SSM, ACL; Visualization: IK, FNA, AMR, AK, VPF, KS; Writing - original draft: IK, FNA, AMR, AK, JCW; Writing - review & editing: IK, FNA, AMR, SSM, ACL, VPF, AJS, GDL, KS.