 |
 |
- Search
| Neurospine > Volume 21(1); 2024 > Article |
|
|
Abstract
Objective
Methods
Results
NOTES
Funding/Support
This study received no specific grant from any funding agency in the public, commercial, or not-for-profit sectors.
Author Contribution
Conceptualization: IK, FNA, AMR, VPF, GDL, AJS, KS; Data curation: IK, FNA, AMR, SSM, ACL, KRM, OOO, EZ, AK, JCW; Formal analysis: IK, FNA, AMR; Methodology: IK, FNA, AMR, VPF, GDL, AJS, KS; Project administration: SSM, ACL, KRM, OOO, EZ, AK, JCW, KS; Visualization: IK, FNA, AMR; Writing - original draft: IK, FNA, AMR; Writing - review & editing: IK, FNA, AMR, SSM, ACL, KRM, OOO, EZ, AK, JCW, VPF, GDL, AJS, KS.
Fig. 1.
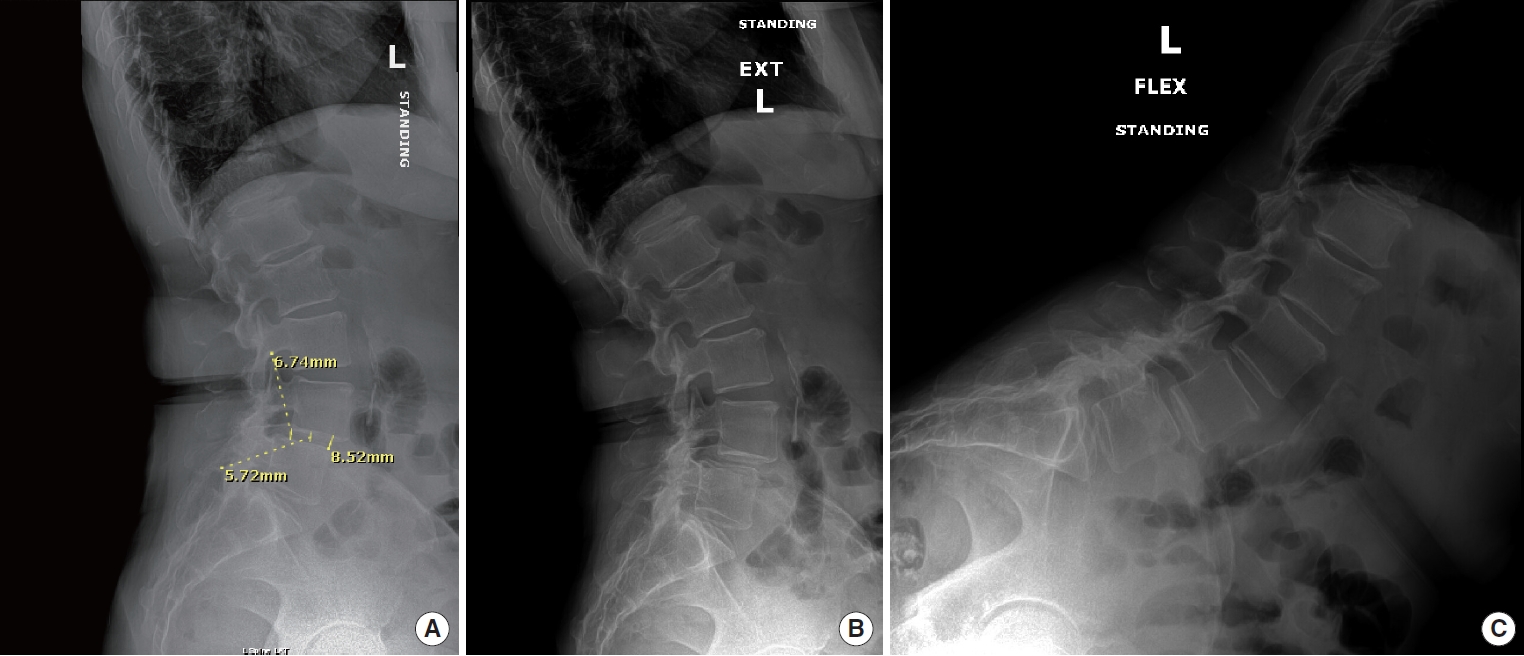
Fig. 2.
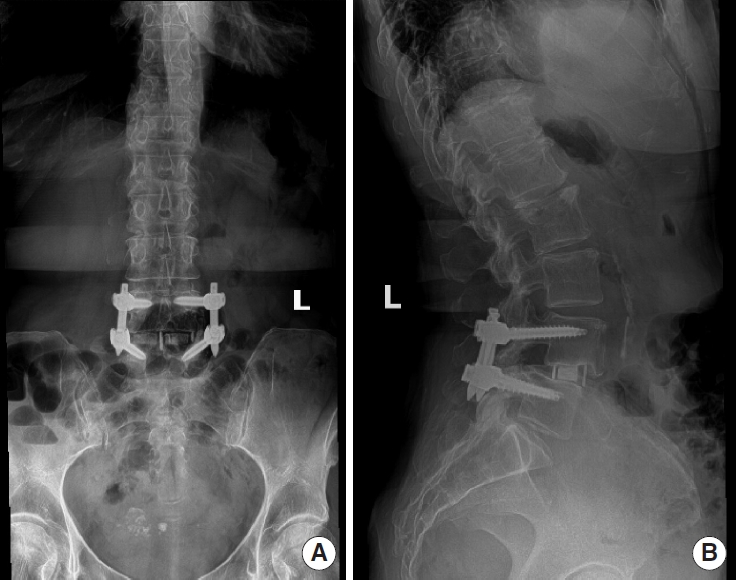
Table 1.
| Characteristic | Total (n = 79) | VR-12 MCS < 50 (n = 25) | VR-12 MCS ≥ 50 (n = 54) | p-value† |
|---|---|---|---|---|
| Age (yr) | 60.61 ± 8.40 | 61.58 ± 7.73 | 60.16 ± 8.72 | 0.487 |
| Female sex | 35 (44.3) | 13 (52.0) | 22 (40.7) | 0.349 |
| BMI (kg/m2) | 30.22 ± 5.91 | 31.04 ± 6.11 | 29.85 ± 5.84 | 0.414 |
| Ethnicity | 0.359 | |||
| Black | 10 (12.8) | 4 (16.0) | 6 (11.3) | |
| Asian | 2 (2.6) | 1 (4.0) | 1 (1.9) | |
| Hispanic | 6 (7.7) | 3 (12.0) | 3 (5.7) | |
| White | 55 (70.5) | 14 (56.0) | 41 (77.4) | |
| Other | 5 (6.4) | 3 (12.0) | 2 (3.8) | |
| Comorbidities | ||||
| Smoker | 8 (10.1) | 4 (16.0) | 4 (7.41) | 0.239 |
| Hypertension | 32 (40.5) | 12 (48.0) | 20 (37.0) | 0.356 |
| Diabetes | 11 (13.9) | 5 (20.0) | 6 (11.1) | 0.289 |
| ASA PS classification | 0.784 | |||
| ≤2 | 57 (74.0) | 19 (76.0) | 38 (73.1) | |
| >2 | 20 (26.0) | 6 (24.0) | 14 (26.9) | |
| CCI score | 2.92 ± 2.13 | 3.2 ± 1.66 | 2.80 ± 2.32 | 0.437 |
| Insurance type | 0.128 | |||
| Medicare/Medicaid | 7 (9.0) | 2 (8.0) | 5 (9.4) | |
| Workers’ compensation | 10 (12.8) | 6 (24.0) | 4 (7.6) | |
| Private | 61 (78.2) | 17 (68.0) | 44 (83.0) | |
| No. of fused levels | 0.145 | |||
| One | 59 (76.6) | 20 (83.3) | 39 (73.6) | |
| Two | 17 (22.1) | 3 (12.5) | 14 (26.4) | |
| Three | 1 (1.30) | 1 (4.17) | 0 (0) | |
| Spinal pathology | ||||
| Degenerative spondylolisthesis | 54 (68.4) | 18 (72.0) | 36 (66.7) | 0.635 |
| Isthmic spondylolisthesis | 10 (12.7) | 1 (4.0) | 9 (16.7) | 0.115 |
| Recurrent herniated disc | 5 (6.3) | 1 (4.0) | 4 (7.4) | 0.563 |
| Central stenosis | 77 (97.5) | 23 (92.0) | 54 (100) | 0.035* |
| Foraminal stenosis | 51 (64.6) | 19 (76.0) | 32 (59.3) | 0.148 |
| Operative time (min) | 139.47 ± 56.97 | 133.96 ± 10.41 | 142.02 ± 8.08 | 0.562 |
| Estimated blood loss (mL) | 46.96 ± 22.27 | 4.72 ± 22.61 | 45.59 ± 22.20 | 0.434 |
| Length of stay (hr) | 25.91 ± 19.55 | 28.43 ± 4.34 | 24.72 ± 2.55 | 0.437 |
| POD 0 VAS pain | 4.79 ± 2.02 | 5.80 ± 0.43 | 4.32 ± 0.24 | 0.002* |
| POD 0 narcotic consumption (OME) | 43.7 ± 24.76 | 51.7 ± 6.05 | 40.0 ± 2.87 | 0.050 |
Table 2.
| Variable | Total (n = 79) | VR-12 MCS < 50 (n = 25) | VR-12 MCS ≥ 50 (n = 54) | p-value† |
|---|---|---|---|---|
| Preoperation | ||||
| VR-12 MCS | 58.96 ± 5.50 | 41.12 ± 5.45 | 58.96 ± 5.50 | |
| VR-12 PCS | 32.46 ± 9.57 | 27.70 ± 6.33 | 34.66 ± 10.04 | 0.002* |
| SF-12 MCS | 51.55 ± 10.46 | 39.15 ± 5.66 | 57.46 ± 6.09 | < 0.001* |
| SF-12 PCS | 30.40 ± 8.13 | 27.62 ± 5.58 | 31.73 ± 8.84 | 0.056 |
| PROMIS-PF | 35.67 ± 6.95 | 32.47 ± 6.32 | 37.23 ± 6.78 | 0.011* |
| PHQ-9 | 4.84 ± 5.14 | 8.48 ± 4.97 | 3.16 ± 4.32 | < 0.001* |
| VAS-BP | 6.14 ± 0.28 | 7.15 ± 2.11 | 5.68 ± 2.39 | 0.014* |
| VAS-LP | 5.46 ± 2.74 | 6.06 ± 2.74 | 5.19 ± 2.72 | 0.209 |
| ODI | 37.09 ± 1.78 | 48.29 ± 14.18 | 31.49 ± 12.83 | < 0.001* |
| 6-Week postoperation | ||||
| VR-12 MCS | 55.29 ± 8.73 | 48.50 ± 9.32 | 57.72 ± 7.19 | 0.002* |
| VR-12 PCS | 34.84 ± 9.36 | 30.61 ± 7.47 | 36.45 ± 9.57 | 0.032* |
| SF-12 MCS | 53.71 ± 9.45 | 49.12 ± 9.51 | 55.42 ± 8.97 | 0.039* |
| SF-12 PCS | 31.57 ± 1.27 | 29.12 ± 6.87 | 32.45 ± 9.41 | 0.250 |
| PROMIS-PF | 37.72 ± 0.90 | 34.30 ± 5.96 | 39.13 ± 5.89 | 0.013* |
| PHQ-9 | 3.62 ± 3.43 | 5.59 ± 3.26 | 2.66 ± 3.12 | 0.003* |
| VAS-BP | 3.35 ± 2.17 | 4.17 ± 2.30 | 3.02 ± 2.05 | 0.073 |
| VAS-LP | 2.82 ± 2.55 | 2.91 ± 2.42 | 2.79 ± 2.62 | 0.881 |
| ODI | 30.42 ± 15.85 | 37.72 ± 14.53 | 27.49 ± 15.57 | 0.028* |
| Final postoperation | ||||
| VR-12 MCS | 56.89 ± 9.12 | 50.0 ± 10.2 | 59.71 ± 6.98 | < 0.001* |
| VR-12 PCS | 40.66 ± 12.14 | 36.84 ± 9.80 | 42.21 ± 12.74 | 0.096 |
| SF-12 MCS | 55.00 ± 9.70 | 48.71 ± 11.77 | 57.59 ± 7.45 | 0.001* |
| SF-12 PCS | 38.59 ± 11.78 | 34.70 ± 9.67 | 40.19 ± 12.30 | 0.118 |
| PROMIS-PF | 44.15 ± 8.38 | 39.56 ± 7.83 | 46.18 ± 7.87 | 0.003* |
| PHQ-9 | 3.39 ± 4.06 | 5.26 ± 3.63 | 2.41 ± 3.96 | 0.005* |
| VAS-BP | 3.31 ± 2.28 | 4.32 ± 2.37 | 2.87 ± 2.12 | 0.023* |
| VAS-LP | 2.61 ± 3.05 | 3.49 ± 3.35 | 2.19 ± 2.83 | 0.046* |
| ODI | 24.13 ± 20.10 | 33.96 ± 23.06 | 19.52 ± 16.91 | 0.004* |
| Δ Preoperation to 6-week postoperation | ||||
| VR-12 MCS | 1.19 ± 8.33 | 6.24 ± 9.25 | -0.612 ± 7.28 | 0.005* |
| VR-12 PCS | 3.16 ± 1.22 | 4.23 ± 7.85 | 2.76 ± 9.87 | 0.596 |
| SF-12 MCS | 1.39 ± 9.63 | 8.95 ± 7.34 | -1.42 ± 9.63 | < 0.001* |
| SF-12 PCS | 1.61 ± 9.48 | 2.11 ± 7.41 | 1.43 ± 10.22 | 0.827 |
| PROMIS-PF | 2.18 ± 7.38 | 4.37 ± 7.00 | 1.33 ± 7.46 | 0.229 |
| PHQ-9 | 1.40 ± 4.04 | 2.6 ± 4.75 | 0.84 ± 3.60 | 0.167 |
| VAS-BP | 3.02 ± 3.01 | 3.51 ± 3.69 | 2.83 ± 2.73 | 0.463 |
| VAS-LP | 2.79 ± 3.88 | 3.56 ± 3.77 | 2.49 ± 3.92 | 0.369 |
| ODI | 5.53 ± 15.31 | 10.72 ± 18.29 | 3.34 ± 13.56 | 0.106 |
| Δ Preoperation to final postoperation | ||||
| VR-12 MCS | 3.29 ± 8.48 | 8.42 ± 9.04 | 1.20 ± 7.34 | < 0.001* |
| VR-12 PCS | 8.82 ± 11.33 | 10.14 ± 11.15 | 8.28 ± 11.48 | 0.540 |
| SF-12 MCS | 2.94 ± 9.40 | 8.75 ± 8.75 | 0.55 ± 8.68 | 0.003* |
| SF-12 PCS | 8.50 ± 11.39 | 7.62 ± 10.17 | 8.86 ± 11.96 | 0.717 |
| PROMIS-PF | 2.18 ± 7.38 | 4.37 ± 7.00 | 1.33 ± 7.46 | 0.229 |
| PHQ-9 | 1.98 ± 3.76 | 3.05 ± 4.47 | 1.45 ± 3.29 | 0.121 |
| VAS-BP | 3.08 ± 3.03 | 3.37 ± 3.49 | 2.96 ± 2.86 | 0.645 |
| VAS-LP | 3.12 ± 3.98 | 2.78 ± 4.08 | 3.29 ± 3.96 | 0.627 |
| ODI | 13.51 ± 19.53 | 15.14 ± 27.68 | 12.68 ± 14.00 | 0.626 |
| MCID achievement | ||||
| VR-12 MCS | 20 (28.99) | 11 (55.00) | 9 (18.37) | 0.002* |
| VR-12 PCS | 58 (84.06) | 15 (75.00) | 43 (87.76) | 0.189 |
| SF-12 MCS | 16 (29.09) | 10 (62.50) | 6 (15.38) | < 0.001* |
| SF-12 PCS | 44 (80.00) | 11 (68.75) | 33 (84.62) | 0.182 |
| PROMIS-PF | 40 (74.07) | 12 (75.00) | 28 (73.68) | 0.920 |
| PHQ-9 | 19 (31.67) | 11 (55.00) | 8 (20.00) | 0.006* |
| VAS-BP | 52 (76.47) | 14 (63.64) | 38 (82.61) | 0.084 |
| VAS-LP | 47 (70.15) | 15 (68.18) | 32 (71.11) | 0.806 |
| ODI | 39 (57.35) | 11 (47.83) | 28 (62.22) | 0.256 |
Values are presented as mean±standard deviation or number (%).
VR-12, Veterans RAND 12-item health survey; MCS, mental composite score; PCS, physical composite score; SF-12, 12-item Short Form health survey; PROMIS-PF, Patient-Reported Outcomes Measurement Information System physical function; PHQ-9, Patient Health Questionnaire-9; VAS-BP, visual analogue scale back pain; VAS-LP, visual analogue scale leg pain; ODI, Oswestry Disability Index; MCID, minimal clinically important difference.
Table 3.
| PROM | Pearson correlation coefficient | p-value† |
|---|---|---|
| PROMIS-PF | ||
| Preoperative | 0.422 | < 0.001* |
| 6 Weeks | 0.374 | 0.012* |
| 12 Weeks | 0.553 | < 0.001* |
| 6 Months | 0.635 | < 0.001* |
| 1 Year | 0.458 | 0.011* |
| 2 Years | 0.637 | 0.019* |
| SF-12 PCS | ||
| Preoperative | 0.376 | 0.002* |
| 6 Weeks | 0.333 | 0.021* |
| 12 Weeks | 0.277 | 0.076 |
| 6 Months | 0.692 | < 0.001* |
| 1 Year | 0.185 | 0.329 |
| 2 Years | 0.107 | 0.683 |
| VR-12 PCS | ||
| Preoperative | 0.537 | < 0.001* |
| 6 Weeks | 0.385 | 0.003* |
| 12 Weeks | 0.390 | 0.004* |
| 6 Months | 0.674 | < 0.001* |
| 1 Year | 0.294 | 0.065 |
| 2 Years | 0.477 | 0.039* |
| VAS back | ||
| Preoperative | -0.397 | < 0.001* |
| 6 Weeks | -0.287 | 0.041* |
| 12 Weeks | -0.555 | < 0.001* |
| 6 Months | -0.779 | < 0.001* |
| 1 Year | -0.312 | 0.106 |
| 2 Years | -0.599 | 0.052 |
| VAS leg | ||
| Preoperative | -0.241 | 0.04* |
| 6 Weeks | -0.124 | 0.386 |
| 12 Weeks | -0.498 | 0.001* |
| 6 Months | -0.578 | < 0.001* |
| 1 Year | -0.183 | 0.351 |
| 2 Years | -0.563 | 0.071 |
| ODI | ||
| Preoperative | -0.626 | < 0.001* |
| 6 Weeks | -0.292 | 0.038* |
| 12 Weeks | -0.599 | < 0.001* |
| 6 Months | -0.567 | < 0.001* |
| 1 Year | -0.383 | 0.044* |
| 2 Years | -0.408 | 0.213 |
VR-12, Veterans RAND 12-item health survey; MCS, mental composite score; PCS, physical composite score; SF-12, 12-item Short Form health survey; PROM, patient-reported outcome measure; PROMIS-PF, Patient-Reported Outcomes Measurement Information System physical function; VAS, visual analogue scale; ODI, Oswestry Disability Index.
Table 4.
| PROM | Pearson correlation coefficient | p-value† |
|---|---|---|
| SF-12 MCS | ||
| Preoperative | 0.972 | < 0.001* |
| 6 Weeks | 0.798 | < 0.001* |
| 12 Weeks | 0.962 | < 0.001* |
| 6 Months | 0.976 | < 0.001* |
| 1 Year | 0.926 | < 0.001* |
| 2 Years | 0.813 | < 0.001* |
| PHQ-9 | ||
| Preoperative | -0.609 | < 0.001* |
| 6 Weeks | -0.581 | < 0.001* |
| 12 Weeks | -0.751 | < 0.001* |
| 6 Months | -0.827 | < 0.001* |
| 1 Year | -0.785 | < 0.001* |
| 2 Years | -0.617 | 0.058* |
REFERENCES

- Related articles in NS
-
Journal Impact Factor 3.2


